Batch Processing System: Spark on Kubernetes, and Why Your Jobs Are Slow
Scheduling, shuffle, data skew, dynamic allocation, and the operational patterns that decide whether a 4-hour batch job is a cost centre or an outage risk.
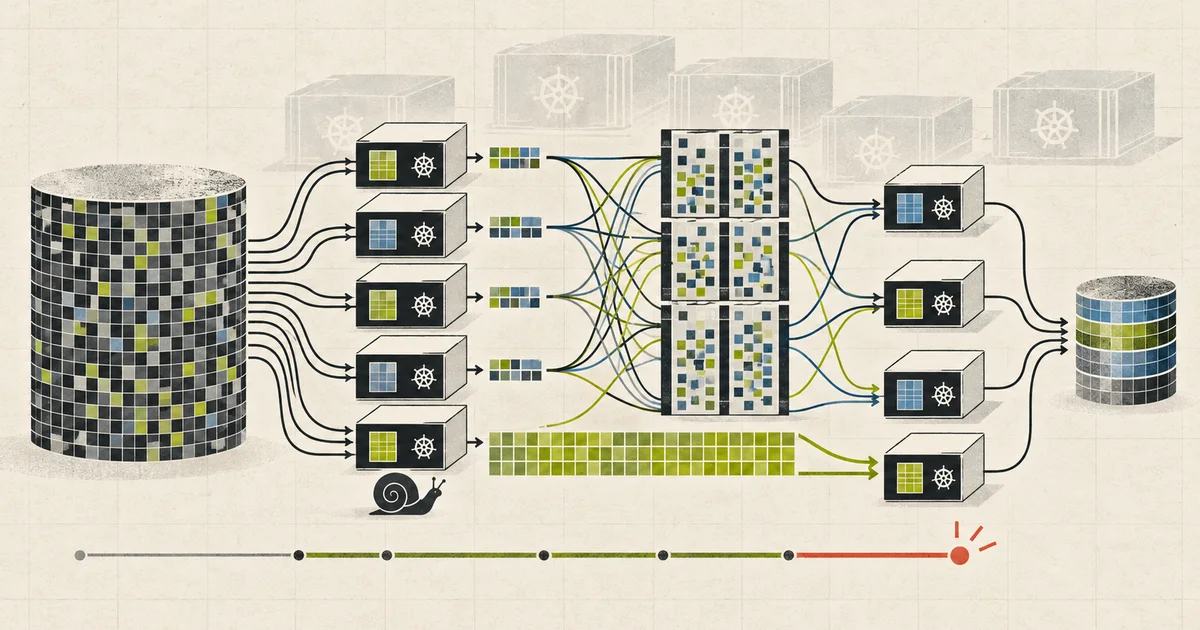
Batch processing has an undeserved reputation for being simple: read some data, transform it, write it out, go home. That reputation comes from the toy case where the whole dataset fits in memory.
The real case is 4 TB across 40,000 files with a join that does not fit on one machine, running on a cluster shared with everything else, on a schedule, with a dependency chain that puts a four-hour job in someone’s morning report. The complexity is not in the transformation. It is in the shuffle, the cluster, and the fact that a slow job is a slow dependency.
The scale and where the time actually goes
  4 TB, 40,000 Parquet files
  500 GB after a filter
  a join on customer_id
  = 2 billion rows on each side

  the work
    scan          parallel, scales well
    shuffle       2 billion rows x 200 bytes
                  = 400 GB moved across the network
    join          the expensive part
    write         80 GB of results

  on a 200-node cluster (800 cores, 3.2 TB RAM)
    scan:          4 min
    shuffle write: 18 min
    shuffle read:  22 min
    join:          95 min
    write:         11 min
    --------------
    total:         ~2.5 hours
Two observations. The join is 60% of the runtime and it is the only part that is hard to parallelise, because it needs the data for a key on the same node. And the shuffle is 40% of the runtime and it is pure overhead — data is written to disk and read back across the network only to be regrouped.
Optimising a batch job means reducing shuffle or making it cheaper. Everything else is marginal.
The shuffle, and why it exists
  a groupByKey or a join needs all rows
  with the same key on one node

  before
    node 1: A A A B B        node 2: A C C D D
    node 3: B B C C C        node 4: A A D D E E

  after shuffle on "letter"
    node 1: A A A A A A     (all the As)
    node 2: B B B B
    node 3: C C C C C
    node 4: D D D D
    node 5: E E

  the mechanism
    map task writes (key, value) to the
    partition that key hashes to
    -> local disk write
    -> the map task ends
    -> reduce tasks fetch their partition
    -> local disk read
    -> combine
Three things follow that matter operationally.
Shuffle data is on local disk, not in memory. A large shuffle that does not fit in the memory allocated for it spills to disk and reads it back, and that spill is where a job’s runtime goes to die. --shuffle-spill metrics tell you whether it happened.
Shuffle is the unit of recovery. A map task that has written its partition can be retried without re-running, and the executor that did it is not needed. That is what makes stage-level recovery possible and it is why a lost node costs minutes rather than hours.
Shuffle is the unit of cache eviction. A cached stage holds its output partitions on executors, and a stage whose partitions are gone has to be recomputed. If your job caches a big stage and then loses executors, it recomputes the cache rather than failing, and you see a job that mysteriously got slower halfway through.
The three things that make a batch job slow
1. Too much shuffle
The most common cause. A shuffle that should not exist at all.
  bad: a shuffle where a broadcast would do

    fact: 2 billion rows, 40,000 distinct customer_id
    dim:  40,000 rows, 1 MB

    a join here should broadcast the dimension
    to every executor: 1 MB, instant
    instead Spark may shuffle the 400 GB fact
    table because the planner estimated
    the small side wrongly, or because the
    join is not expressed in a form that
    can broadcast

    fix: broadcast join hint, correct
         statistics, and make sure the
         dimension is actually small
Broadcast joins can be a high-leverage optimisation, but “the table fits in an executor” is not enough. Every executor receives a copy, the driver has to materialise and distribute it, concurrent joins multiply the footprint, and stale statistics can make the planner choose badly in either direction. Confirm the physical plan and peak executor memory; use a hint only when the measured plan is wrong and the small side has a stable upper bound.
Partitioning is the other version of this. If your fact table is already partitioned by the join key, joining to that partitioning is a co-partitioned join with no shuffle at all. Ingesting a table partitioned the way it will be joined is a data modelling decision made months before the query, and it is worth far more than any tuning knob.
2. Skew
  40,000 distinct customer_id
  one customer has 200 million rows
  (a bot, a test account, a bad integration,
   or legitimately the largest customer)

  199 tasks: 10 million rows each    4 min
  1 task:   200 million rows         80 min
  stage time = 80 min, not 4
One skewed key makes a stage 10 to 100 times slower than its peers, and the symptom is distinctive: the job spends most of its time on one task, one executor is at 100% CPU while the rest idle, and the stage before or after the join takes far longer than the same transformation on a smaller table.
Three fixes, in order of preference.
Split the hot key. If the hot key is a string, append a random suffix to create N sub-keys, shuffle on the suffixed key so the work spreads, then aggregate the N sub-results. This is the general solution.
  hot key "cust_00042", 200M rows
    -> cust_00042_00 ... cust_00042_63
    -> shuffle on the salted key
    -> 64 tasks, 3M rows each
    -> aggregate the 64 partial sums
Two-phase aggregation. Aggregate the hot key’s rows in a first pass, then combine the partial aggregates. Cheaper than salting when the values are already aggregatable.
Isolate and handle separately. Detecting the hot keys explicitly and processing them on their own path. More code, but it works when the hot key is genuinely huge and you want visibility into it.
The real lesson is that skew is a data quality issue wearing a performance costume. A customer with 200 million rows is a bug in an integration somewhere. A pipeline that measures key distribution and alerts on skew is preventing a performance incident and a correctness one at the same time.
3. Small tasks and scheduling overhead
  40,000 files, 128 MB each
  a target partition size of 128 MB
  = 40,000 tasks

  if 4 of those tasks finish in 40ms
  and 1 takes 90 seconds
  the stage takes 90 seconds and
  39,996 tasks did nothing useful
Task granularity is a tuning decision with a floor: below roughly 200 MB per task, scheduling and serialisation overhead dominates and the job gets slower, not faster. Above a few GB, you lose parallelism and lose the ability to retry cheaply. The sweet spot for most work is a few hundred MB to a couple of GB per task, and a 4 TB job wants something in the range of 2,000 to 8,000 tasks.
This is also where the numbers that people quote go wrong. “Reduce partitions to increase parallelism” is advice that was true when the data was small. On 4 TB, more partitions is more parallelism, and the failure is the opposite one — a job with 200 tasks and 800 cores that uses a quarter of the cluster.
The cluster: Spark on Kubernetes
Running Spark on a cluster is a good idea and it introduces a specific problem: there are now two schedulers, and they are not talking.
  Spark driver
      |
      | asks for executors
      v
  Kubernetes scheduler
      |
      | creates pods, assigns them to nodes
      v
  Spark's own scheduler assigns tasks
  to the executors that appeared

  the failure mode
    Spark requests 500 executors
    K8s has room for 200 right now
    -> 200 pods created
    -> Spark waits for 500
    -> the application is NOT running any tasks
    -> it looks like a slow start
    -> it may hit a client timeout and fail
The behaviours that make this work.
Dynamic allocation needs shuffle preservation. Shuffle tracking is the simplest option on many Kubernetes deployments: Spark retains executors that hold shuffle data needed by active jobs and can remove them when that data is no longer needed. It is not the only option. Spark also supports an external shuffle service, executor decommissioning with shuffle-block migration, and compatible reliable shuffle storage. Pick one deliberately, then measure executor churn and recomputation; “dynamic” does not mean “automatically optimal.”
A fixed executor pool is the alternative and it is defensible when you know your job’s shape, when you want predictable resource usage, or when a shared cluster’s churn is a problem for someone else. The cost is that it is a static guess about a dynamic workload, and the guess is wrong on a day when the data doubles.
Resource requests must be honest. A Spark pod that requests 2 CPUs and 8 GB and actually uses 1 CPU and 2 GB holds a quarter of the cluster hostage. Resource configuration is where multi-tenant clusters go wrong, and the effect is invisible from the job’s own metrics — the job reports its own progress, not the fact that it is monopolising a node.
Spark’s history server and the event log are your only post-mortem. A job that failed tells you nothing about why in its logs; the stage-level breakdown in the event log is what shows a skewed stage, a spill, or a slow task. A production Spark job without the event log retained is a job you cannot debug after the fact.
Scheduling, and the four-hour job in your critical path
  08:00  daily orders job         45 min
  08:45  revenue aggregation      20 min
  09:05  customer segments        6 hours
  15:05  exec dashboard refresh

  the dashboard is 7 hours stale
  and the dependency is not a
  technical problem, it is a
  dependency ordering problem
The instinct is to optimise the six-hour job. Usually the better answer is to change what depends on what.
Isolate the freshness-critical path. The dashboard needs today’s revenue and yesterday’s segments, not a full recompute of segments. Split the job so a small, fast path feeds the report and the full rebuild runs later.
Incrementalise. Most analytical recomputations only need to process changed data. The incremental version processes a day’s delta, and the full rebuild becomes a weekly reconciliation rather than a daily requirement.
Run it on the data as it lands. If segments depend on orders, and orders are being written continuously, the segment job can run incrementally against the arriving data instead of waiting for the orders job to finish. This removes the serial dependency entirely and is a scheduling change, not a performance one.
Know what the SLA actually is. A dashboard that is seven hours stale is fine for a weekly review and a crisis for an operational one. Writing down which is which prevents a six-hour job from being optimised when nobody needed it to be.
Failure stories worth testing
Insert 200 million rows under one customer_id
Run the job and confirm the skew detector fires. This is the test that finds a bad integration before it finds a 6-hour runtime.
Remove the broadcast hint from a dimension join
Confirm the runtime multiplies. The change is invisible in the code review and catastrophic in the runtime, and it is worth making people see both.
Partition a fact table the way it is joined
Confirm the shuffle disappears. This is the highest-leverage change available and it is a data layout decision, not a query change.
Fill the shuffle beyond memory and force a spill
Measure the difference. Spill is where a two-hour job becomes a twelve-hour job, and it is invisible unless you are watching the spill metrics.
Drop from 200 to 20 partitions on a 4 TB job
Confirm it gets slower, not faster. The folk advice about fewer partitions is wrong at this scale and this is the test that proves it.
Make the event log unavailable
Confirm what evidence remains. Executor and driver logs, Kubernetes events, metrics, and the Spark event log answer different questions. The event log is what reconstructs the Spark UI after the application exits; without it, stage, task, and SQL-plan diagnosis becomes much harder, but ordinary logs are still essential for crashes, container eviction, and application errors.
Run three Spark jobs on the cluster simultaneously
Confirm they coexist. Spark’s dynamic allocation and K8s’s scheduling interact badly when both are making decisions, and the symptom is pending pods and jobs that appear hung.
Corrupt one executor’s disk mid-stage
Confirm the stage recomputes from the shuffle rather than failing. Stage-level recovery is a real property of shuffle and worth seeing work.
Exceed the driver memory on a job with 40,000 tasks
Confirm the failure mode. Driver memory is a function of the number of tasks and the size of the metadata, and it is a limit you will hit.
Run the segment job while orders are still being written
Confirm whether the output is consistent. Reading a table that is being appended to gives a job that finishes and produces numbers that do not add up.
Reduce the cluster by half during a job
Confirm the job adapts. Dynamic allocation reclaims executors, and a job that assumed a fixed pool fails rather than slowing down.
A production-ready architecture
   data (Parquet/Iceberg, partitioned)
        |
        | partitioned by the join key
        | where possible -> co-partitioned,
        | no shuffle at all
        v
  +---------------------------+
  |  Spark driver             |  DAG, stages, tasks
  |  - 2,000-8,000 tasks      |  a few hundred MB each
  |  - driver memory sized    |
  |    for task count         |
  +------------+--------------+
               | request executors
               v
  +---------------------------+
  |  Kubernetes               |  honest CPU/memory requests
  |  - scheduler for pods     |  priority classes per job
  |  - Spark schedules tasks  |  the two-scheduler problem
  +------------+--------------+
               |
               v
  +---------------------------+
  |  dynamic allocation       |  WITH shuffle tracking
  |  - shrink when stages end |  so shuffle output can
  |  - grow for the next one  |  be released and the
  |    without re-reading     |  executor reclaimed
  +------------+--------------+
               |
        stage boundaries = recovery units
        cached stages = eviction risk
               |
               v
  +---------------------------+
  |  event log / history      |  the only real
  |  stage breakdown, task   |  post-mortem record
  |  timings, spill metrics  |
  +---------------------------+

  freshness-critical path (small, fast, incremental)
  full rebuild (nightly or weekly, isolated)

  every job: skew check on key distribution,
             spill metrics, duration SLO,
             event log retained
A sensible delivery checklist:
- Partition tables by the key they are joined on. It is worth more than every tuning knob combined and it is a schema decision made early.
- Broadcast every dimension small enough to fit. Check the plan, because a planner that estimates wrongly will shuffle a 400 GB fact table instead.
- Detect skew explicitly: measure key distribution per input and alert, rather than waiting for a stage to take six hours.
- Know the skew fix for your hot keys — salting, two-phase aggregation, or isolation — and have it written down before you need it at 2am.
- Target a few hundred MB to a couple of GB per task, and size the partition count from data volume rather than from folklore.
- If you enable dynamic allocation, configure one supported shuffle-preservation strategy and verify it under executor removal; otherwise size a fixed pool deliberately.
- Make resource requests honest. A pod requesting 4x what it uses is a quiet denial of service to every other job.
- Retain the event log. Without it, every failure is a mystery.
- Watch spill metrics. Spill is the difference between a two-hour job and a twelve-hour one.
- Give jobs priority classes and a fair share so a large job cannot monopolise the cluster.
- Separate the freshness-critical path from the full rebuild. A daily report that needs a full recompute is a dependency problem.
- Incrementalise anything that runs more than once a day. Most full recomputations only need the changed data.
Common mistakes
| Mistake | What actually happens | Better decision |
|---|---|---|
| Inner join on a large fact table | 400 GB shuffled for a 1 MB dimension | Broadcast the small side |
| No skew detection | One hot key, one 6-hour stage | Measure key distribution, alert |
| Skew handled by raising memory | One executor grows until the node dies | Salt, two-phase aggregate, or isolate |
| Fact table not partitioned by join key | Every join shuffles both sides | Partition at ingest for the join |
| 200 partitions on 4 TB | Quarter of the cluster used, job slow | Size partitions from data volume |
| 40,000 tasks on 4 TB | Scheduling overhead dominates | Target hundreds of MB per task |
| Dynamic allocation without shuffle preservation | Executors cannot leave safely or shuffle is recomputed | Tracking, external service, decommission migration, or reliable storage |
| Fixed executor pool on variable work | Under- or over-provisioned by design | Dynamic, or a justified fixed pool |
| Resource requests 4x actual use | Silent monopolisation of nodes | Honest requests, verified against usage |
| No event log retained | Every failure is undebuggable | Retain and index the event log |
| Spill metrics not watched | Job is 6x slower and nobody knows why | Alert on shuffle spill |
| Driver memory not planned for task count | OOM at 40,000 tasks | Size driver memory for the task count |
| Spark and K8s schedulers conflicting | Pending pods, jobs that appear hung | Understand both, tune requests |
| Full recompute for a fresh report | Serial 7-hour dependency | Incremental path for freshness |
| Long job with no priority class | A big job starves everything else | Priority classes, fair share |
| Reading a table being appended to | Job finishes, numbers do not add up | Snapshot or watermark isolation |
| Cache a huge stage | Silent recompute when executors are lost | Cache deliberately, size the risk |
| No duration SLO on the job | Slowdown noticed by a user | Alert on duration against expected |
| Tuning SQL before checking the plan | Optimising the wrong thing | Read the physical plan first |
| One cluster, no quotas | Any job can take everything | Per-team quotas and priorities |
The complete story in one minute
A batch job is often slow because it moves too much data, moves it unevenly, or schedules work at the wrong granularity. Those are starting hypotheses, not a law: source I/O, serialization, spill, garbage collection, scheduler delay, and a slow sink can dominate too. The physical plan and per-stage metrics decide which one is true for this job.
Too much shuffle is the most common and the most fixable — broadcast the dimension when it fits, and partition fact tables by the key they are joined on so the join is co-partitioned and shuffles nothing. Both are invisible in the code review and enormous in the runtime. Skew is the second: one key with 200 million rows makes a stage ten times slower than its peers, and the fix is salting, two-phase aggregation, or isolating the hot key. Skew is really a data quality problem, because a customer with 200 million rows is a bug in an integration somewhere. The third is task size, where too few tasks wastes the cluster and too many makes scheduling overhead dominate.
On Kubernetes there are two scheduling layers with different information. Spark requests executors; Kubernetes places the resulting pods subject to cluster capacity and policy. Dynamic allocation can return idle executors, but only with a supported way to preserve needed shuffle output, and its limits still need tuning. Retain the event log so the history server can reconstruct stages and SQL plans, and retain driver, executor, and Kubernetes logs for the failures the event log does not explain.
Finally, a six-hour job in a morning report is a dependency problem more than a performance one. Split the freshness-critical path from the full rebuild, incrementalise against arriving data, and write down which staleness is actually acceptable.
partition for the join, broadcast the small side
detect skew before it becomes a six-hour stage
dynamic allocation + a deliberate shuffle-preservation strategy
event log + application logs + Kubernetes events
The hard part was never writing the transformation. It was noticing that the job was slow because of one key, and that nobody had looked at the key distribution in a year.
Technical references
Related notes.
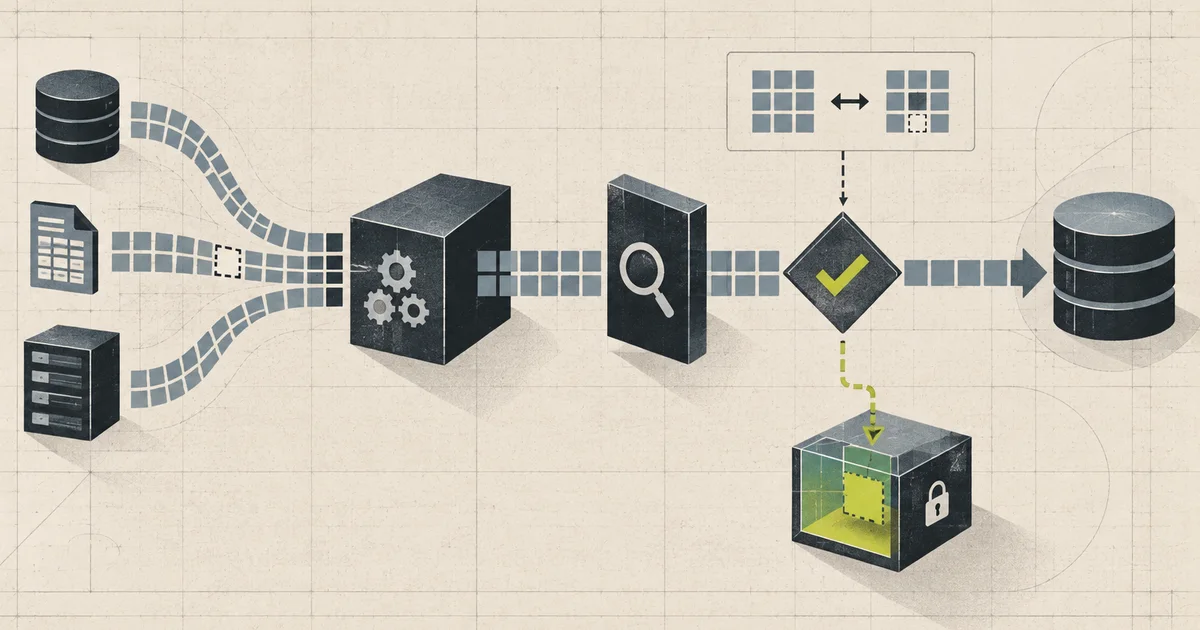
ETL Pipeline: The Extract That Fails Silently Is Worse Than the One That Crashes
Incremental extraction, idempotent loads, late-arriving data, backfills, and the data quality checks that decide whether anyone trusts the warehouse.
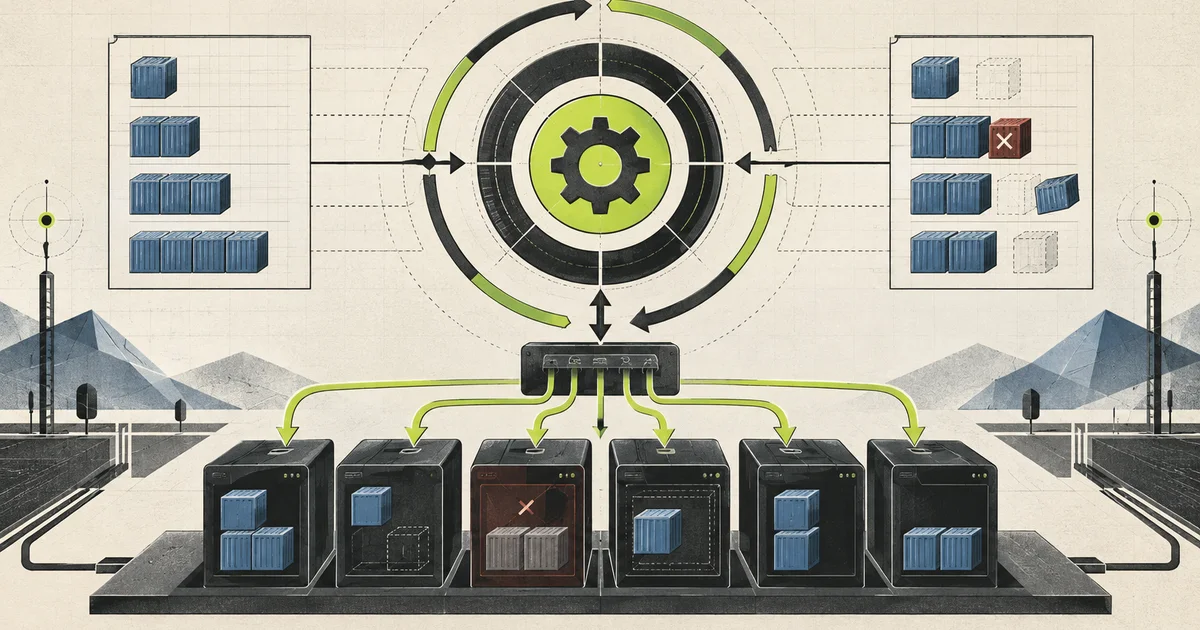
Container Orchestration: The Scheduler Is Easy, the Controller Is the Product
Two-phase scheduling, level-triggered reconciliation, the pod lifecycle, and why a Kubernetes-style control loop is the reusable idea underneath every orchestrator.

Travel Review Platform: Moderation, Fraud, and the Recency Problem
Running a travel review platform at scale — review eligibility, fraud detection, ranking that resists gaming, and the moderation workflow that makes it trustworthy.