IoT Analytics Platforms: Hot, Warm, Cold, and the Query That Breaks All Three
Tiered storage for device telemetry, the wide-versus-narrow table decision that changes everything, and why rolling data up is cheaper than querying it raw.
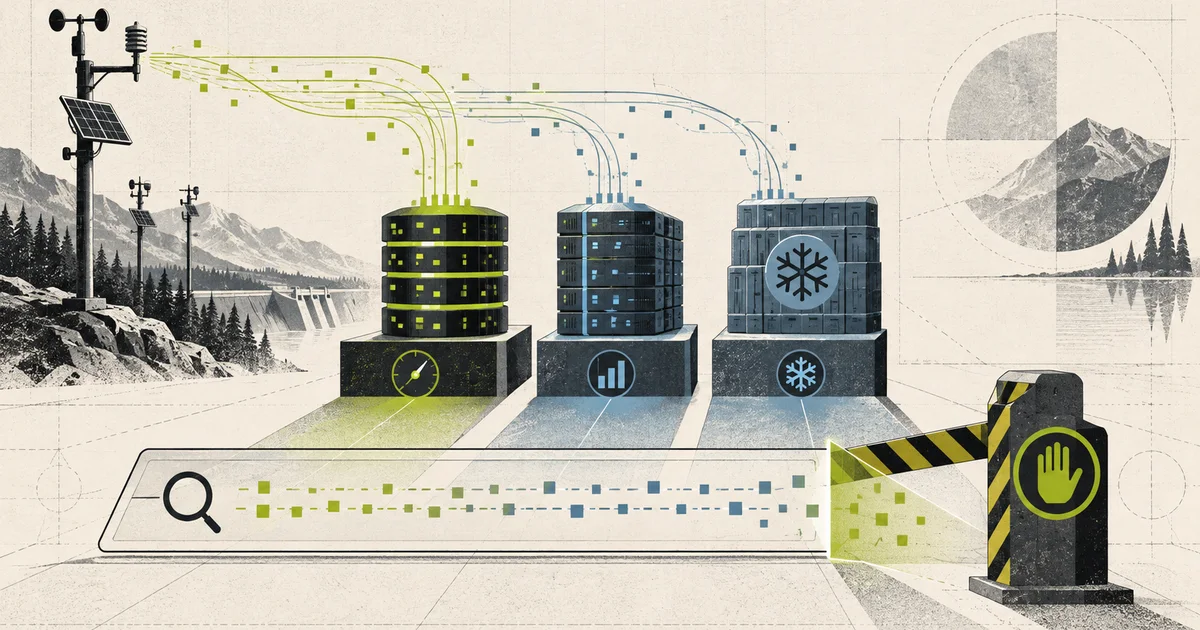
Device telemetry is awkward for analytics in a specific way. Each row is nearly worthless on its own, there are a great many of them, and every useful question is an aggregate over time and a group of devices.
That combination is exactly what operational databases are bad at and analytical databases are good at, and the mistake almost every IoT platform makes is discovering this after the first dashboard takes the database down.
The same fleet, from the ingestion article
Five million devices, each reporting four metrics every thirty seconds.
5,000,000 / 30 sec                    = 166,667 reports/sec
x 4 metrics                            = 666,667 readings/sec
666,667 x 86,400                       = 57.6 billion readings/day
x 365                                  = 21 trillion readings/year
Twenty-one trillion readings a year. Now the questions people actually ask:
- average temperature per device, last 24 hours
- p99 vibration for the fleet, last 7 days
- monthly energy per site, last 2 years
- which devices report irregularly
- total readings ingested yesterday, as a reconciliation number
Not one of them needs the raw rows. They need aggregates, and the aggregates are one to three orders of magnitude smaller than the raw data.
Why the operational store is the wrong place
The time series store from the ingestion path holds recent data well. It is optimised for “give me the last hour of device 4412’s temperature”, which is a narrow range query on one series.
Analytical questions are the opposite shape.
operational:  one device, narrow time range, raw points
analytical:   every device, wide time range, aggregated
That second shape fights the first one in three ways.
It reads far more data. A fleet-wide aggregate over 24 hours touches every row for every device. In an operational store with compression tuned for one series at a time, that is a large scan.
It holds no dimensions. The time series store knows device 4412 exists. It does not know 4412 is at site 7, in region 3, running firmware 4.2. Adding that means a join, and the operational store is not built for joins against a relational dimension table.
It competes with ingestion. The analytics query arrives while telemetry is still arriving, and both want the same resources. The query is the one with no deadline, so it should yield. Building that in is much easier than retrofitting it.
The rule that follows: the operational path stores recent data for serving, and the analytical path answers questions about aggregates. Overlap is fine. Coupling is not.
Three tiers, because one storage engine cannot do both
hot   -> last 24 to 72 hours, finest available resolution
warm  -> up to 2 years, rolled up to 1 minute, 5 minutes, 1 hour
cold  -> everything, as Parquet in object storage
Each tier is cheaper than the one above it, in exchange for resolution.
| Tier | Store | Resolution | Answers |
|---|---|---|---|
| hot | time series or ClickHouse | raw, 30s | debugging, live dashboards, incident forensics |
| warm | ClickHouse | 1m, 5m, 1h | fleet analysis, trends, reporting, capacity |
| cold | Parquet + Trino, DuckDB, Spark | as stored, or SQL at query time | ad-hoc exploration, model training, long history |
Routing is the whole design. A query arrives with a time range, and the router picks the tier with the coarsest resolution that still answers it.
"last 15 minutes, device 4412"        -> hot, raw
"last 7 days, fleet average"          -> warm, 1-hour rollup
"last 2 years, monthly per site"      -> warm, daily rollup
"compare 2024 against 2021"           -> cold, Parquet
Doing this well means the answer is usually the cheapest tier, and the expensive path is the exception rather than the default. Most platforms do the opposite and then discover their analytics bill is larger than their ingestion bill.
The wide-versus-narrow decision
This is the highest-leverage choice in the whole platform and it is made in the first week, when it is cheap to get right and expensive to change.
Narrow, one row per reading:
recorded_at | device_id | metric | valueFour metrics at the same instant is four rows.
Wide, one row per device per instant:
recorded_at | device_id | temperature | humidity | pressure | vibrationFour metrics at the same instant is one row.
The row count difference for the fleet above:
narrow:  21 trillion rows/year
wide:     5.26 trillion rows/year
A factor of four, before any optimisation. And the storage difference is larger than the row count difference, because a columnar store compresses each column independently and can treat temperature as a temperature column for the entire fleet rather than as a value that is sometimes temperature and sometimes vibration.
A narrow table also has a data-model problem. metric becomes a value in a column, which means every aggregate has to either filter on it or pivot over it, and the column that holds the numbers is a string dictionary lookup per row. In a columnar engine that is close to the worst possible layout.
The honest caveat is that wide tables are inflexible. Adding a new metric is a schema change, and a fleet with genuinely heterogeneous metrics ends up with a sparse table full of nulls. The rule of thumb that works is:
metrics that are reported together, on every device, at the same rate -> wide
metrics that are sporadic, rare, or device-specific                -> narrow
A fleet reporting temperature, humidity, pressure, and battery on the same thirty-second cycle is four columns. A firmware version string that changes occasionally is a table of its own.
Rollups, and why they are not a compromise
Aggregation is computed once at ingest, not every time somebody asks.
raw       5.26e12 rows/year    30 second resolution
1 minute  2.63e12 rows/year    2x fewer
5 minutes 5.26e11 rows/year    10x fewer
1 hour    4.38e10 rows/year    120x fewer
1 day     1.83e9 rows/year     2,870x fewer
Now the cost of a question. Average temperature across the fleet for the last seven days:
raw, 30 second:   5M devices x 20,160 rows each = 1.0e11 rows
1 hour rollup:    5M devices x 168 rows each    = 8.4e8  rows
                                            reduction: 120x
And the two answers are the same. Averaging an hourly mean of hourly means is exact for a mean, because a mean has no order dependence. The same is not true of a p99, and it is not true of anything involving interpolation or a count of events.
So the rollup ladder has to be built per metric, according to what the metric is:
mean, sum, count, min, max  -> safe to average from any coarser tier
percentiles                -> need a sketch, not a rollup of percentiles
distinct counts            -> cannot be rolled up without over-counting
A p99 computed as the average of hourly p99s is not a p99. If percentiles matter, store a t-digest or similar sketch per tier and merge the sketches, which is what the sensor pipeline article described, and which is the only correct way to keep a fleet-wide p99 across a year.
ClickHouse for the hot and warm tiers
ClickHouse is the default answer for this shape of workload and the reasons are specific rather than general.
Columnar storage. Only the columns a query touches are read. A query over temperature and time reads two columns out of six, which is a third of the bytes, and it is the compression story from the time series article applied to a much wider table.
Vectorized execution. Batches of a few thousand values are processed with tight loops over contiguous memory, which is where the ten to hundred times advantage over row-oriented execution comes from on aggregations.
Sparse primary index. One index entry per granule of rows rather than per row, so the index for five trillion rows is small enough to stay in memory.
Parts and merges. Each insert batch becomes an immutable part. Queries read all parts and merge results. Background merges consolidate small parts into large ones, and the count of un-merged parts is the metric that tells you whether merges are keeping up.
Materialised views. A rollup is a view that runs on insert, which is exactly the rollup ladder described above, and the database maintains it rather than a separate job that can fall behind.
The operational discipline is the same as everywhere else here:
part count per table
rows per part            -> too small means the merge is behind
bytes read per query
parts currently merging
time since last successful merge
A table with thousands of small parts will query badly, and the cause is almost always an insert pattern that produces small batches. Batch inserts, and check the part count after changing anything about how you insert.
Joining telemetry to dimensions
Telemetry rows have a device id and nothing else. Every useful question needs more: which site, which region, which firmware, which asset type.
That is a join, against a device registry of five million rows.
readings (840,000,000 rows) x device_registry (5,000,000 rows)A five-million-row registry is roughly 80 MB. That fits in memory, which is the fact the entire join strategy depends on.
The approach is to load the dimension into a dictionary and resolve the lookup per row rather than sorting both sides. Columnar engines are built for this, and the difference between a hash join over billions of rows and a dictionary lookup is one to two orders of magnitude.
SELECT dictGetString('device_registry', 'region', device_id) AS region,
       avg(temperature) AS avg_temp
FROM readings_wide_1h
WHERE recorded_at >= :since
GROUP BY region
The corollary is that the device registry must be treated as a genuinely small, genuinely bounded thing. It is the natural place to put things that are not small, and doing so is how an analytical query that used to take a second turns into a join nobody can finish.
If a dimension genuinely will not fit in memory, the honest options are to aggregate before joining, which loses the detail, or to accept the join cost and budget for it. The bad option is pretending the small table is small.
Cold tier: Parquet and a query engine
Object storage holds the archive, and the format is Parquet for reasons that have become boring and important:
- columnar, so a query reads only the columns it needs;
- compressed per column, with statistics per row group so queries skip data;
- splittable, so a large scan parallelises across many workers;
- readable from many engines with no lock-in.
The query engine on top is a choice of posture rather than of correctness.
Trino or Presto for federated SQL across many sources, at the cost of a distributed query coordinator you now operate.
DuckDB for a single-process, embarrassingly parallel engine that reads Parquet directly from object storage. For a lot of ad-hoc exploration this is dramatically simpler and faster than running a cluster, and it is the right default for a platform with a handful of engineers doing exploration.
Spark when the query genuinely needs to be a batch job at a scale where the others are insufficient, and you accept the operational weight.
The number that makes the cold tier worthwhile: at 5.26 trillion raw rows a year, Parquet with good column statistics and row group sizes is often an order of magnitude cheaper per query than the equivalent query in a database, because you are paying for the bytes you read rather than for provisioned capacity.
The query that breaks the system
There is always one. On a platform this size it is usually a dashboard that nobody owns.
"show me every reading for every device in region 3 for the last two years"What happens: the router sends it to the cold tier, the query scans two years of Parquet, the coordinator schedules four hundred workers, and the object storage request rate goes to zero for every other user on the account.
The controls that prevent it, and all of them are needed:
A maximum scanned-bytes limit, enforced before execution. Not after. A cost estimate the user can see and confirm is better than a hard failure, and both are better than discovering it on a bill.
A statement timeout. A query that has not finished in the time budget is killed and the partial result is discarded. A runaway query is worse than a failed one.
A concurrency limit per user and per dashboard. This is the control that protects other people, and it is the one most often missing.
Result row caps. Returning fifty million rows to a browser is never what anybody wanted.
A separate path for exports. A download of a large dataset is a background job that writes to object storage, not an HTTP request that holds a connection open.
The general principle is that an analytics platform needs a quota system, and the quota system is not an afterthought. On a platform where one query can cost more than a month of ingestion, it is the product.
Failure stories worth testing
Roll the hot tier’s retention from 7 days to 1 day
An existing query that assumed a week will now silently return less data. Confirm the platform refuses or warns rather than quietly truncating.
Break a rollup job
The raw tier still answers, so the platform should keep working with a visible warning. Confirm that no user-facing figure silently changes resolution without saying so.
Let a device register report a million new devices
Confirm the dictionary reload is bounded and that queries do not fall over during it. The registry is small until it is not.
Merge a new metric into the existing wide table
A schema change across five trillion rows. Confirm it is a cheap metadata operation or that you have an explicit migration plan, because the alternative is a rewrite.
Run a deliberately expensive query as a normal user
Confirm it is capped, killed, and attributed to the user. Then confirm the attribution is visible to the user rather than only in a log.
Take object storage away
The cold tier fails. The hot and warm tiers should be unaffected, and the router should report the cold tier as unavailable rather than silently falling back to an expensive scan.
Introduce a p99 metric
Confirm it is stored as a sketch per tier and that the fleet-wide p99 is merged rather than averaged. Then check whether anyone had already been averaging hourly p99s, because if so the previous numbers were wrong.
Corrupt a Parquet file in the archive
Confirm the query returns an explicit error for that object rather than a silently shorter result set.
A production-ready architecture
  devices -> ingestion -> Kafka
                        |
              +---------+----------+
              |                    |
      +-------v--------+   +-------v----------------+
      | Hot tier       |   | Rollup writer          |
      | raw 30s        |   | 1m, 5m, 1h, 1d        |
      | 24 to 72 hours |   +-------+----------------+
      +-------+--------+           |
              |                    v
              |            +-------+----------------+
              |            | Warm tier             |
              |            | ClickHouse, 2 years   |
              |            +-------+----------------+
              |                    |
              |                    v
              |            +-------+----------------+
              |            | Cold tier             |
              |            | Parquet, object store |
              |            +-------+----------------+
              |                    |
              +---------+----------+
                        v
              +-------------------+
              | Query router      |
              |  by time range    |
              +---------+---------+
                        |
        +---------------+----------------+
        |               |                |
   dashboards       ad-hoc SQL      exports (job)
                    (Trino/DuckDB)
Alongside, and small on purpose:
  device registry -> in-memory dictionary, ~80 MB, reloaded periodically
  query governor   -> timeouts, row caps, scan-byte limits, concurrency
  provenance       -> which rollup answered, at what resolution
A sensible delivery checklist:
- Separate the operational write path from the analytical read path, in storage and in resource limits.
- Decide wide versus narrow per metric group, on the first week, and migrate deliberately.
- Build the rollup ladder in the write path, not as a backfill job.
- Route queries by time range to the coarsest tier that answers them.
- Store percentiles as sketches and merge them. Never average a percentile.
- Keep the dimension tables small enough to hold in memory, and resist putting anything else in them.
- Instrument part counts and merge lag on the analytical store.
- Add a query governor with timeouts, row caps, scan limits, and concurrency caps before the first expensive query.
- Export large datasets as background jobs, not as HTTP requests.
- Report the resolution a figure was computed at, alongside the figure.
Common mistakes
| Mistake | What actually happens | Better decision |
|---|---|---|
| Analytics queries on the operational store | A dashboard competes with ingestion and both degrade | Separate analytical storage |
| Narrow tables for metrics reported together | Four times the rows and a string dictionary on the value column | Wide table, one row per device per instant |
| Aggregating percentiles from rollups | The fleet p99 is not a p99 and nobody can tell | Sketches, merged per tier |
| Querying raw for a year-long question | Tens of trillions of rows for a number that already exists | Route to the coarsest rollup that answers it |
| No query governor | One dashboard costs more than a month of ingestion | Timeouts, row caps, scan limits, concurrency caps |
| Exports as HTTP requests | A connection is held open while a background job runs | Export as a job writing to object storage |
| Dimension tables quietly becoming large | A dictionary lookup becomes a join nobody can finish | Keep the registry small; aggregate or budget for it |
| No part-count monitoring | Merges fall behind and queries degrade slowly | Alert on part count and merge lag |
| Silent resolution changes | A figure changes because the rollup tier changed, unexplained | Report the resolution a figure was computed at |
| Rollups built as a backfill | They are always behind and never authoritative | Compute them on insert |
| A heterogeneous metric in a wide table | A mostly-null table where the common case pays for the rare one | Rare metrics belong in their own narrow table |
| Cold tier with no query engine | An archive nobody can query is not an archive | Trino, DuckDB, or Spark on Parquet |
| Relying on a single tier for everything | Either the query is too slow or the storage is too expensive | Three tiers and a router |
The complete story in one minute
Five million devices report four metrics every thirty seconds, which is 21 trillion readings a year. Almost nobody wants the raw rows. They want averages, percentiles, and comparisons, and those are one to three orders of magnitude smaller than the data behind them.
So the metrics that are reported together live in a wide table, one row per device per instant, which is four times fewer rows and lets each column be compressed as itself. The data goes into three tiers: a hot tier of raw data for the last few days, a warm tier of one-minute, five-minute, and hourly rollups for two years, and a cold tier of Parquet in object storage for everything.
A query router sends each request to the coarsest tier that can answer it, so a two-year comparison reads a daily rollup rather than scanning two years of raw readings. A seven-day fleet average reads an hourly rollup, which is a hundred and twenty times fewer rows and gives the same number, because a mean has no order dependence.
Percentiles are the exception and are stored as sketches that merge, because averaging hourly ninety-ninth percentiles produces a number that is not a ninety-ninth percentile. Device metadata stays small enough to sit in memory as a dictionary, so dimension lookups are dictionary reads rather than joins across billions of rows.
Behind all of it is a query governor with timeouts, row caps, scanned-byte limits, and concurrency caps, because a platform where one query can cost more than a month of ingestion needs quotas as a first-class feature rather than a hope.
That is the whole path:
devices -> Kafka -> hot raw -> rollups -> warm -> cold Parquet
                             |        |
                             +-- router by time range --> query governor --> user
The hard parts were never the storage engine. They were deciding which questions people actually ask, rolling the answers up before anyone asks them, and building the limits that keep one careless query from costing more than the platform.
What this team still owns
Every rollup is a contract: event-time field, lateness policy, correction behaviour, unit, dimensions, retention, and provenance back to raw observations. A materialised aggregate must say whether it is final, provisional, or recomputed under a new rule version. Tenant budgets apply to scanned bytes, concurrent queries, exported rows, and scheduled work—not just request count—so one unbounded group-by cannot turn a shared analytics plane into an outage.
Technical references
Related notes.

Price Alert System: Notifying People About Prices You Cannot Promise
Price alert infrastructure — polling strategies, trigger thresholds, alert fatigue, and the honesty problem when the price moves after you alert.
Fleet Management Systems: The Platform Is Telematics, the Product Is Exceptions
Hours-of-service compliance, driver behaviour scoring as an employment decision, fuel leakage, and why a fleet system's real value sits in the five percent of cases that are not normal.

Smart City Platforms: Designing for a Federation, Not a Product
Why the hard problem in city data is departmental ownership rather than throughput, and what to do about coordinate systems, spatial joins, privacy, and data quality you can defend.