Last-Mile Delivery System: The Problem That Is 80% Small Talk and 20% Optimisation
Last-mile delivery route design, density-based territory planning, failed delivery recovery, and the operational details that dominate the economics.
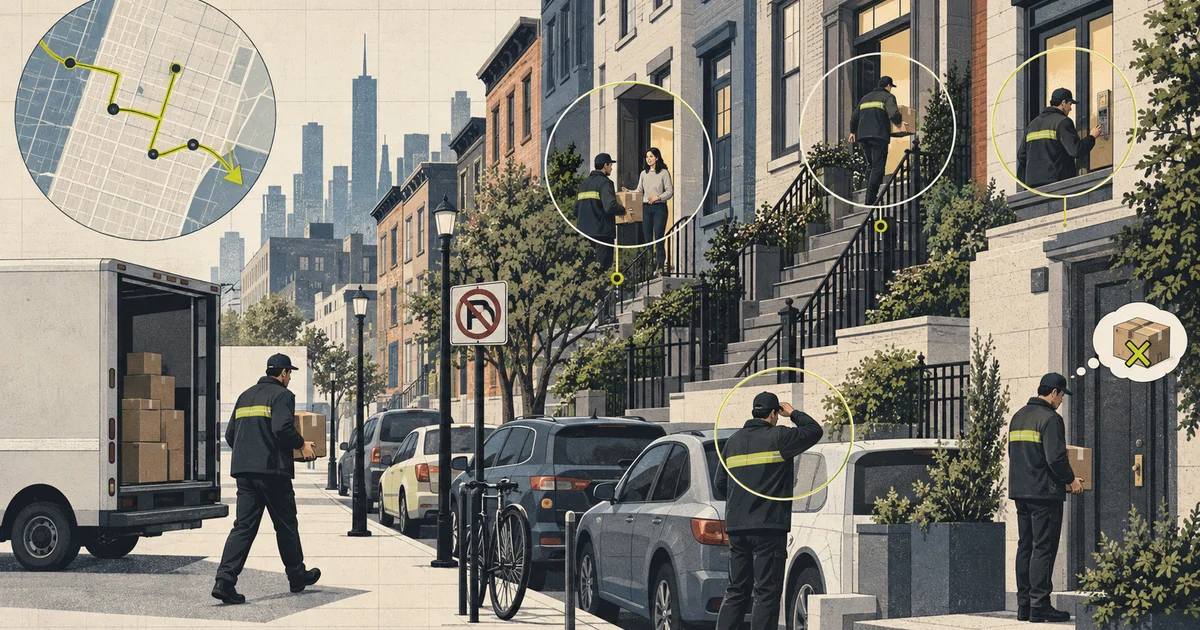
The last mile is where a parcel network stops being a freight business and becomes a logistics business. The parcels are small, the customers are individual, the addresses are wrong a nontrivial fraction of the time, and the stop has a cost floor that no routing algorithm gets below: you still have to park, walk, and hand something over.
This is an article about that reality, and about which parts of it are actually optimisable.
The scale, and where the money actually goes
  a national parcel network
    50,000 routes per day
    12 million stops per day
    240 stops per route
    ~140 stops per driver-hour
       (the real number, after all the friction)

  cost per stop, illustrative breakdown
    line-haul to depot            8%
    sortation and handling        12%
    DRIVE to the stop            18%
    PARK and find the door       14%
    WALK to the door             10%
    WAIT for the customer        16%
    FAILED delivery recovery     12%
    payment, app, support        10%

  the insight
    only ~18% of last-mile cost is the
    drive between stops

    the stop itself is ~55%
That table is the whole article in miniature. A team that spends a year improving the drive is optimising 18% of the cost. A team that moves failed deliveries from 8% to 3% has captured roughly a third of the total cost reduction available, and it is usually easier.
The routing problem, and why it is not the hard part
  a day of stops
    240 stops
    9 hours of available time
    - 1h break
    - 45 min depot at start and end
    = 7.25 hours of route time

  at 4 min per stop
    240 x 4 = 960 min = 16 hours
    -> 2.2 days of work in one route

  the arithmetic that shocks people
    the promised route assumes ~2.4 min
    per stop; reality is 4-6
    the gap is parking, walking, waiting,
    and the fact that "4 min" is a mean
    with a long tail
The per-stop cost is the dominant variable and it is not something a routing algorithm controls. What the algorithm controls is the sequence, and the achievable improvement in sequence is real but bounded:
  realistic gains
    naive per-driver sequence         baseline
    nearest-neighbour + 2-opt         8-15% better
    time-window-aware with reordering  15-25% better
    full VRP with service-time model   25-35% better

  but
    25% better sequence
    and the drive is 18% of cost
    -> ~5% total cost improvement

  vs
    failed deliveries 8% -> 3%
    -> ~5% of total cost, same effort

  and
    average service time 5:00 -> 4:15
    -> 240 x 45s = 3 hours recovered
    -> that is a whole extra route per day
That last line is the one that gets attention in operations. Reducing the mean service time is worth more than a perfect route, because it converts directly into routes that can be completed. Service time is a distribution with a long right tail, and most of the leverage is in attacking the tail rather than the mean.
Territory design: the invisible disaster
  a route that looks fine
    240 stops, 38km of driving, 6.2h total

  the same stops, better territory
    240 stops, 31km of driving, 5.9h total

  where did the 7km go?
    - a cluster of 20 apartments in a
      different part of the postcode
    - a "business" zone with 8 stops
      spread over 4km, each needing
      a signature and a different opening
      window
    - 3 stops the previous driver added
      because the regular driver was on
      holiday and "he knew"

  territory quality shows up as
    driving time and variation between drivers
    and is invisible in any single route metric
Territory design is a clustering problem — partition the demand into territories that are geographically coherent, respect depot boundaries and driver contracts, and have a balanced workload. The requirements that make it hard are not the geography:
Capacity balance across days. A territory must produce a stable stop count per day, not a wildly variable one, because the stop count is what determines whether a route is completable. Weekly-volume-based territories handle this; daily-optimised boundaries do not.
The unassignable stops. Every territory ends up with a handful of awkward stops — a rural delivery, a site with restricted access, a customer who only ever wants Friday — and how those are handled determines whether the rest of the territory is clean. Many operations formalise this with an “exceptions” queue and a small specialist route, and that is better than pretending the optimiser will handle them.
Turnover. When a driver leaves, the territory is rebuilt. If territory generation takes two days, the operation stalls. So territory generation has to be fast and re-runnable, which argues for a repeatable clustering pipeline rather than a bespoke analysis.
Fairness across drivers. Balanced volume, balanced revenue, and balanced difficulty. Difficulty is the one people forget: a territory of 200 easy residential stops is easier than 180 mixed ones with 20 difficult ones, even though the volume is lower.
Failed delivery recovery, the second optimisation
  first attempt fails because
    - nobody home (35%)
    - address not found / incomplete (20%)
    - access refused (12%)
    - business closed (15%)
    - unsafe location (8%)
    - address needs correcting (10%)

  recovery options, roughly in order of cost
    1. RESCHEDULE to another day
       cheapest, no travel
    2. REDIRECT: a nearby driver already
       in the postcode picks it up
    3. REDRIVE: the same route next day
       costs a whole extra stop
    4. DEPOT RETURN + re-sort
       most expensive, last resort
    5. CONTACT customer for a better
       address or instructions, then
       redeliver on a normal route
The cost ranking matters more than the technology. The cheapest recovery is a reschedule to a normal route, not a special trip. A failure-recovery module that optimises the special trip in isolation will produce a better special trip and a worse total outcome, because it does not know that a reschedule is nearly free.
The genuinely hard recovery case is the address problem, and it is a data problem. Addresses that do not geocode, geocode to the wrong place, or geocode to a building rather than a unit are responsible for a large share of failures, and the fix is upstream: address validation at order capture, using the delivery history for that address if it exists, and asking the customer for a photo or a note. A system that learns from “this address failed 4 times, here is what the driver found” and feeds it back to order capture is worth more than any amount of recovery optimisation.
The routing consequence: recovery stops should be inserted into nearby existing routes, not run as a separate vehicle. The optimisation is a set-insertion problem — for each failed parcel, find the route and position that adds the least total cost, subject to the route having slack. This is the same cheapest-insertion primitive as the route optimiser, and it is much cheaper than re-optimising.
Density changes the system
  DENSE URBAN
    400+ stops/route
    20-40 min per stop is common
    walking dominates
    - apartment buildings, buzzer systems
    - no parking ever
    - the driver carries 150 parcels
    - the constraint is carry weight and
      time, not distance
    -> territories are tight, routes are
       near-sequential, the vehicle is a
       mobile locker

  SUBURBAN
    150-250 stops/route
    4-6 min per stop
    parking is mostly fine
    - the route is genuinely geographic
    - time windows and signature
      requirements drive the sequence
    -> classic VRP, territory design matters
       most here

  RURAL
    40-80 stops/route
    drive time dominates
    - the route is 90% driving
    - the constraint is geography, and
      route length, not stops
    -> this is a different product with
       the same software
Anyone who has watched a single configuration struggle in the suburbs while looking excellent in the city and terrible in the countryside has watched the failure mode this section predicts. The three cases have different dominant costs, different binding constraints, and different definitions of a good route, and the parameters that produce them differ by an order of magnitude.
The pragmatic response is not three products. It is one system with density as an explicit input to territory generation, stop-time models, and vehicle provisioning — plus the discipline to acknowledge that a rural route at 90% driving time will always look like a bad route next to a dense one at 30% driving time, and that comparing them is meaningless.
The vehicle and carry capacity constraint
  a dense route
    240 parcels
    - 1.2 kg average (mixed)
    - a 23 kg carry limit per person
    - 240 x 1.2 = 288 kg
    - 288 / 23 = 12.5 trips to the door

  this is not a joke constraint
    it determines:
      - vehicle size and count
      - whether the vehicle is a walking
        route with a cart, a van, or a
        cargo bike
      - how many times the driver returns
        to the vehicle
      - the shape of the route, because a
        return-to-vehicle step is a step
Cargo bikes and walking routes are worth taking seriously rather than as a sustainability project. In a dense European city they are faster than a van for a surprising number of stop counts, because the van spends more time looking for parking than delivering. The design consequence is that the route becomes a set of “out-and-back” micro-routes around the vehicle, which is a different combinatorial problem, and a system that assumes point-to-point driving will produce nonsense plans for a bike.
Failure stories worth testing
Improve the route sequence by 25% and measure the operational effect
If completion barely moves, the sequence was not the constraint. This is the single most useful test to run before investing further in routing.
Set the mean service time to 4:00 with a long tail, and see the completion rate
Measure how many routes fail. The tail, not the mean, determines whether the plan is real.
Rebuild territories daily instead of weekly
Measure the change in driving time and in driver-reported frustration. Daily boundaries destroy the local knowledge that makes a route fast.
Remove the exceptions queue and force all stops into territories
Watch rural, restricted-access, and Friday-only stops. The territories become unusable around them.
Compare one driver’s route with another’s in the same territory
The difference is usually local knowledge. That gap is what you are measuring when you say routing improvement is limited.
Deliver 200 parcels by cargo bike versus van on the same dense route
Measure end-to-end completion, not distance. Parking time is often the whole difference.
Add 15% more stops per route and see the completion rate
Completion collapses non-linearly past a threshold. The threshold is the real capacity number.
Make a failed parcel’s address a wrong building on a 200-unit complex
Compare address validation at capture versus recovery. Upstream fix is worth far more than re-sorting.
Route failed parcels as a dedicated vehicle versus inserted into nearby routes
The insertion option should win on cost by a wide margin.
Add a new apartment block to a territory
Check the rebalancing. Volume spikes locally, service time per stop changes (lift, buzzer), and a naive territory model breaks.
Set all time windows to 9-5 on a suburban route
Compare with signature-required stops. Signature requirements create a different route problem from time windows.
Test the rural case with the urban parameters
Rural completion will be poor and the cause will be obvious in hindsight: the system was optimising for the wrong cost.
Force a driver to take an extra 20 parcels above standard
Measure the extra time. If the increase is superlinear, the capacity number is wrong.
Add a customer who requires a signature and is home 7am-7am
This is a data quality bug that looks like an optimisation failure for a week.
A production-ready architecture
   order capture
     - address validation + geocode
     - service-time estimate from history
     - density classification
        |
        v
  +----------------------------------------------------------+
  |  DEMAND MODEL                                            |
  |  - stops per postcode per day, by density band           |
  |  - service time distribution (not a mean)                |
  |  - failure probability by address and area               |
  +----------------------------+-----------------------------+
                               |
                               v
  +----------------------------------------------------------+
  |  TERRITORY GENERATION (weekly)                            |
  |  - geographic clustering within depot/contract bounds    |
  |  - balanced volume, difficulty, revenue                  |
  |  - explicit exceptions queue for awkward stops           |
  |  - stable across driver changes                           |
  +----------------------------+-----------------------------+
                               |
                               v
  +----------------------------------------------------------+
  |  ROUTE GENERATION (per route, per day)                    |
  |  - insertion heuristic -> local search -> LNS             |
  |  - time windows, signature, service-time distribution    |
  |  - carry-capacity step for bike/walk routes              |
  |  - vehicle type matched to density band                   |
  +----------------------------+-----------------------------+
                               |
                               v
  +----------------------------------------------------------+
  |  FAILED DELIVERY RECOVERY                                |
  |  - rank options by cost: reschedule < redirect <         |
  |    redrive < return-to-depot                              |
  |  - set-insert into nearby routes with slack              |
  |  - address fixes fed back to order capture                |
  +----------------------------+-----------------------------+
                               |
                               v
  +----------------------------------------------------------+
  |  EXECUTION + FEEDBACK                                    |
  |  - driver app: sequence, notes, photo proof              |
  |  - actual service times, actual walk distances            |
  |  - failure reasons captured at the door                   |
  +----------------------------+-----------------------------+
                               |
                               v
  +----------------------------------------------------------+
  |  LEARNING                                                |
  |  - per-address service time and failure history          |
  |  - per-driver variance, local-knowledge effect           |
  |  - density model recalibration per band                   |
  +----------------------------------------------------------+

  watch: stops per route hour, completion %, failure rate by reason,
        service time distribution, drive vs walk share, carry trips
Delivery checklist:
- Measure the per-stop cost breakdown before optimising anything. If the drive is 18% of cost, spend your effort on the stop.
- Model service time as a distribution and track the tail. Route feasibility is a tail problem, not a mean problem.
- Design territories for stable daily volume, not for perfect shape. Volume stability is what makes a route completable.
- Formalise an exceptions queue. Awkward stops handled separately beat territories designed around them.
- Rank recovery options by total cost, and make reschedule-to-a-normal-route the default, not a special trip.
- Insert failed parcels into nearby routes with slack rather than running a dedicated recovery vehicle.
- Feed address failures back into order-capture validation. This is the highest-leverage fix in the whole system.
- Use density as an explicit input to territory generation, service-time models, and vehicle provisioning.
- Support out-and-back micro-routes for cargo bike and walking delivery. The combinatorial problem is different.
- Treat carry capacity as a real constraint that adds steps to the route, not a vehicle-sizing detail.
- Track per-driver variance within the same territory. That gap is local knowledge, and it tells you the ceiling on route optimisation.
- Distinguish drive time, park time, walk time, and wait time in your telemetry. You cannot optimise a component you do not measure separately.
- Set route capacity from observed completion data, not from the optimistic planning assumption.
- Never compare completion rates across density bands without normalising for the cost structure.
Common mistakes
| Mistake | What actually happens | Better decision |
|---|---|---|
| Optimising the route sequence | 25% sequence gain = ~5% cost | Attack the stop, not the drive |
| Mean service times | Plans fail on the tail | Distribution, track p90 |
| Daily territory boundaries | Destroys local knowledge, drives up time | Weekly, stable territories |
| Force all stops into territories | Awkward stops poison the boundary | Exceptions queue |
| Dedicated failure-recovery vehicle | Recovery costs far more than it should | Insert into nearby routes |
| No address validation at capture | Failures discovered at the door | Upstream validation and history |
| One configuration for all densities | Excellent in the city, broken in the countryside | Density as an input |
| Point-to-point routes for cargo bikes | Plan is nonsense for out-and-back | Micro-route representation |
| Ignore carry capacity | Driver physically cannot complete | Carry as a route step |
| Route capacity from planning assumptions | Nobody finishes | Capacity from observed completion |
| Compare routes across density bands | Meaningless conclusions | Normalise by cost structure |
| Stop-time aggregate only | Cannot tell parking from waiting | Separate drive/park/walk/wait telemetry |
| Ignore driver variance | Misses the local-knowledge ceiling | Within-territory driver comparison |
| “Retry tomorrow” as the only option | Wastes a full stop cost | Cost-ranked recovery options |
| No failure reason capture | No way to fix the root cause | Capture reason at the door |
The complete story in one minute
Last mile is not the last leg of a routing problem. It is a different problem: small parcels, individual recipients, wrong addresses, and a hard cost floor per stop that no algorithm gets below. The cost breakdown is the whole story — the drive between stops is roughly 18% of last-mile cost, while parking, walking, waiting, and failed deliveries together are more than half. A team that spends a year improving the route is optimising the smaller number, and a team that moves failed deliveries from 8% to 3% captures roughly the same cost reduction for a fraction of the effort. Reducing the mean service time by 45 seconds recovers three hours per 240-stop route, which is a whole extra route per day.
Route sequence improvements are real and bounded: naive sequence to a full VRP with a service-time model is maybe 25-35% better, but applied to the 18% that is driving, that is about 5% of total cost. Territory design is where the invisible waste lives — a cluster of apartments in the wrong postcode, a business zone with eight spread-out signature stops, a few stops added by a driver on holiday who knew the area. Territory should be designed for stable daily volume rather than beautiful shape, and awkward stops belong in an exceptions queue rather than being designed around.
Failed delivery recovery is a second optimisation with different economics, and the cheapest option is rescheduling onto a normal route, not a special trip. Rank the options by total cost, insert recovery stops into nearby routes that have slack, and — the highest-leverage fix in the entire system — feed address failures back into order-capture validation, because a wrong building on a 200-unit complex is a data problem, not a routing problem.
Density changes the product. Dense urban is about carry weight and walk time with the vehicle as a mobile locker; suburban is classic VRP where territory design matters most; rural is 90% driving and needs a different system. And a cargo bike on a dense route often beats a van, because the van spends more time looking for parking than delivering — which makes the route a set of out-and-back micro-routes, a different combinatorial problem entirely.
per-stop cost dominates: parking, walking, waiting, failures
service time as a distribution; territory for stable volume
recovery ranked by cost, reschedule first, insert into slack routes
address failures fixed upstream; density as an explicit input
drive / park / walk / wait measured separately
The hard part was never the routing. It was accepting that most of the last mile is a person on a doorstep, and that the algorithms are the cheap part of making that work.
What this team still owns
The plan is a proposal with a solve timestamp and assumptions, not a commandment. Dispatch owns which constraints are hard, which can be violated with a stated penalty, when to re-solve, and how much route churn a driver can absorb. Delivery owns proof semantics too: GPS proximity is evidence of location, not proof of handoff. Persist the scan, actor, timestamp, media consent, recipient method, and exception reason as separate facts.
Technical references
Related notes.
Driver Dispatch System: Assigning Work When the Vehicle Is Not the Constraint
Freight dispatch with capacity, hours-of-service, and multi-depot realities — the parts of dispatch that a load board does not solve.
Ride Matching Algorithm: Batching, Detours, and the Trade-off Every Marketplace Rediscovers
How ride matching actually works — spatial partitioning, ETA matrices, batch windows, and why lowest-detour and shortest-wait pull in opposite directions.
Dynamic Pricing for Travel: The Model Is the Easy Part
Revenue management for travel — demand forecasting, price fences, the difference between dynamic and surge, and why published prices must be honoured.