Canary Deployment: The Percentage of Your Users Who Find the Bug First
Weighted routing, metric gates that actually mean something, analysis windows versus sample size, and why most canary systems fail at the metric check.
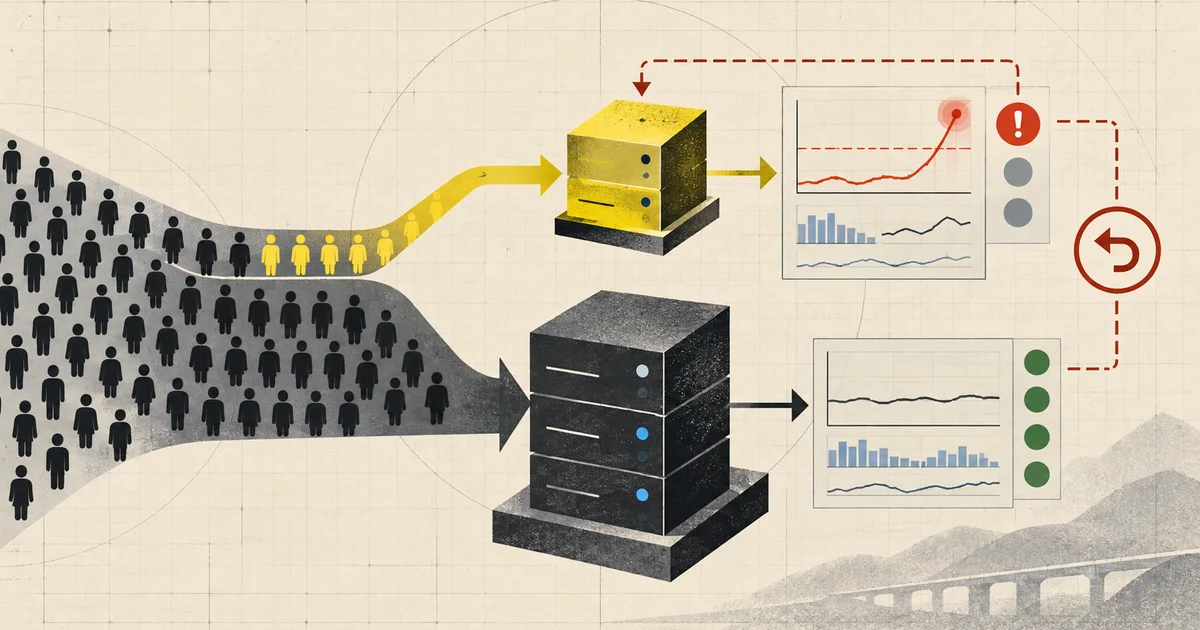
A canary release sends a small percentage of traffic to the new version while everyone else stays on the old one, watches, and then either promotes or rolls back. The concept is a direct lift from electrical engineering, where a new circuit is connected under a small load before it carries the full current.
The engineering of the split is trivial. Almost all of the difficulty is in the middle sentence: watches, and then either promotes or rolls back. Deciding requires statistics, and most canary systems make a decision with less rigour than the term deserves.
The scale and the arithmetic that drives the design
  service at 1,000 requests/sec
  canary at 1%            = 10 requests/sec
  analysis window 10 min  = 6,000 requests

  detect a regression that moves error rate
  from 0.5% to 1.0%
    expected failures, baseline:  0.5% x 6,000 = 30
    observed, canary:            1.0% x 6,000 = 60
    difference:                       30 events
    that is comfortably detectable

  the same canary at 0.1%
    1 request/sec x 600s = 600 requests
    baseline failures:  0.5% x 600 = 3
    canary failures:    1.0% x 600 = 6
    difference:         3 events
    that is noise
This is the entire problem in one calculation. Canary detection power is a function of traffic, sample size, and the size of the regression. A service with 100 requests per second cannot run a 1% canary with a 10-minute window and detect anything smaller than roughly a 10% error-rate increase. The 1% canary at low traffic is theatre.
Three design consequences:
The analysis window is computed, not chosen. You know your request rate, your baseline error rate, and the smallest regression you care about detecting. From those you derive how long the canary must run. If the answer is 40 minutes, the canary runs for 40 minutes, and the deploy pipeline needs to accommodate that.
Low-traffic services need a different mechanism. A 1% canary is statistically useless on a service doing 20 requests a minute. The options are: raise the canary percentage until the sample is meaningful, lengthen the window until it is, use a shadow or dark launch for validation, or accept that this service can only be validated by other means.
Small regressions need longer runs or bigger samples, and both cost time. This is the trade every canary system makes, and it is why the biggest and most dangerous releases should get the longest windows rather than the shortest.
Getting the split right
  +-------------------+
  |  ingress / router |
  +--------+----------+
           |
     hash or cookie
           |
   +-------+--------+
   |                |
   v                v
 +------+      +--------+
 |stable|      |canary  |   v4  (100%)
 |  v3  |      |  v4    |   v4  (1%)
 +-----+      +--------+
The routing decision has three properties worth being deliberate about.
Sticky by user, not by request. If the split is per-request, a single user hits both versions and their session breaks — different behaviour, different cached state, a checkout that fails half the time. Hash on a user or session identifier so a user is consistently on one side. This matters more than it sounds, because inconsistent per-user behaviour makes the metrics harder to interpret as well.
Consistent across requests and services. The same hash must produce the same decision at every hop. If the ingress picks 1% and an internal service re-rolls, you get 1% at the edge and a different, uncorrelated 1% internally, and the population that reached the canary is not the population you measured.
Weighted by risk, not evenly. Traffic percentage and risk percentage are not the same thing. A change to a read path can go to 1%. A change to the write path or to authentication might belong behind a flag that nobody has turned on yet, with the canary controlling exposure rather than proportion.
A note on the sticky-cookie approach: it works, but it means every request carries a decision, and the decision must not be forgeable by a user who wants to reach the canary. If it is only a cookie, someone can set it deliberately. That is acceptable for internal pre-production testing and not acceptable when a bug in the canary affects real users.
The metric gate, and why most of them are wrong
This is where canary systems fail, and they fail in a consistent way: the gate compares an absolute threshold instead of a comparison against control.
  wrong
    alert if error_rate > 1%
    -> the service has a 0.8% baseline
    -> the canary is FINE and gets rolled back
    -> the gate is now ignored by everyone
    -> the next real regression also passes

  right
    alert if canary_error_rate > control_error_rate
                        + error_tolerance
    -> a real regression is a *change* from baseline
    -> normal baseline noise does not trip it
The control comparison is what makes the gate meaningful. It handles the fact that your baseline is not zero and not constant: traffic mix changes hourly, a dependency has its own incident history, and a fixed absolute threshold is either useless or trigger-happy. A relative comparison against the traffic happening right now absorbs all of that.
Three things the gate needs beyond the comparison:
A minimum sample size before the gate is allowed to fire. Until the canary has enough requests, a zero-error observation is not evidence of health, it is absence of data. A gate that fires on “0% errors in 40 requests” against a 0.5% baseline is firing on noise, and it will fire on noise often.
Multiple metrics, with one designated as the gate. Error rate, latency p99, and a business metric like completed checkouts. Exactly one is the pass/fail gate; the others are displayed for diagnosis. A gate that requires all of them to be healthy is a gate that fails on irrelevant fluctuations.
A guardrail metric, separate from the gate. Something that must not degrade even slightly, like authorisation denials or error rate on a critical path. A canary that improves conversion by 0.1% while doubling payment errors is not a win.
Automated analysis: be wrong in one direction
Automating the promote-or-rollback decision is where most of the value is, and it needs a clear stance on error.
  automated analysis
    +-------------------------------+
    |  1. wait for minimum samples  |
    |  2. evaluate gates           |
    |  3. compare canary vs control|
    |  4. decide: promote | rollback| hold
    +-------------------------------+

  a HOLD is a valid outcome
  "not enough data to decide" is a real answer
  forcing a binary decision is how you get
  confident wrong answers
A false positive costs a deploy. A false negative costs an incident. Those are not comparable, so the automated analysis should be biased toward rolling back. A canary that gets rolled back on noise wastes an engineer’s afternoon. A canary that passes on noise takes down a percentage of production traffic.
That asymmetry suggests three things:
- Allow the decision to be “hold”, and escalate to a human, rather than forcing a binary outcome at the deadline. A canary that reaches the end of its window with no decision should page someone, not silently promote.
- Require a stronger signal to promote than to roll back. Promoting on a clear win is fine; rolling back on ambiguity is fine. The reverse is not.
- Never auto-promote a canary that has incomplete telemetry. If the metrics pipeline dropped data during the window, the honest result is inconclusive. A missing data path is not a passing canary.
A subtlety worth naming: automatic analysis assumes the metric is measuring what it claims. A canary that shifts traffic from a cached path to a database path can shift the measured error rate because the metrics instrumentation differs between versions, not because behaviour differs. When a release also changes the observability, the analysis is comparing two different measurements and a human has to be in the loop.
Sticky canaries and long analysis windows create their own failure
A canary running for 40 minutes has 40 minutes in which something else changes: a deploy, a config change, a feature flag, a dependency’s own deploy, an incident.
  t=0    canary starts, 1% of traffic
  t=12   unrelated config change rolled to 100%
  t=18   canary metrics shift
  t=18   analysis: "regression detected"
  t=18   rollback the canary
  t=18   the real cause is still live for the other 99%
The analysis is not wrong about what it measured; it is wrong about attribution. The mitigations are:
- Timestamp and correlate. The analysis view should show deploys and config changes on the same axis as the metrics, so a human reading the result can see that something else happened.
- Freeze other changes during the canary, in the strictest version of this practice. Some pipelines refuse all other deploys to a service while its canary is running. It is unpopular and it is correct.
- Keep the control running through the whole window. The comparison against control is what distinguishes a canary regression from a fleet-wide change, because a fleet-wide change moves both sides.
That last point is the strongest argument for the control design and the reason it is worth the extra complexity: the control is the only part of the system that is guaranteed to be running the old version, so it is the only baseline that survives whatever else happens.
Failure stories worth testing
Deploy a version with a 0.5% error rate and a 1% canary
Confirm the gate does not fire on noise. If it does, the gate is absolute rather than comparative, and it will be ignored during the release you need it for.
Deploy a version with a 5% error rate and a 1% canary
Confirm the gate fires within the analysis window rather than waiting for the deploy to finish. Detection speed is the whole benefit.
Run a canary on a service with 20 requests per minute
Confirm what the system does. It should hold or escalate, not promote. A system that promotes a 1% canary after 40 minutes of 800 requests is making a decision with no statistical content.
Remove the canary percentage and compare against a stale baseline
Confirm the gate catches a regression. A fixed absolute threshold with a stale baseline is the most common reason a bad release gets promoted.
Roll a canary while an unrelated config change hits 100%
Confirm the dashboard shows both, and that the analysis does not confidently blame the canary. This is the attribution test.
Break the metrics pipeline mid-canary
Confirm the analysis reports inconclusive rather than passing. Missing data is the failure mode that gets promoted.
Sticky cookie removed from a user mid-canary
Confirm the user is routed consistently. A user hopping between versions makes both the metrics and their session incoherent.
Have the canary pass the error gate while degrading p99 by 3x
Confirm latency is a gate metric, not just a displayed one. Error-rate-only gates ship latency regressions routinely.
Set the canary percentage to 0% and start a deploy
Confirm the pipeline refuses or that the state is unambiguous. A zero-percent canary that reports “healthy” is a way to publish a release with no validation.
Promote a canary and immediately roll back the promotion
Confirm the routing change is reversible in seconds and that in-flight requests do not get a version split mid-transaction.
Fill the canary with internal traffic from synthetic monitors
Confirm synthetic traffic is either excluded or evenly distributed. Monitors hitting only the canary make a broken version look healthy or an unstable version look broken, depending on which way they are routed.
A production-ready architecture
   release pipeline
        |
        v
   +-----------+
   |  deploy   |  canary at 1%
   |  v3->v4   |  sticky by user id,
   +-----+-----+  same decision at every hop
         |
         v
   +-------------------+
   |  traffic router   |  ingress or mesh
   |  99% -> stable    |
   |   1% -> canary    |
   +-----+---------+---+
         |         |
         v         v
   +--------+  +--------+
   |stable  |  |canary  |
   |  v3    |  |  v4    |
   +--------+  +----+---+
                   |
                   v
   +-------------------------------+
   |  metrics                       |
   |  canary vs control, same      |
   |  window, same traffic mix     |
   |                               |
   |  GATE:   error rate           |
   |  GATE:   latency p99          |
   |  GATE:   business outcome     |
   |  GUARD:  never-worse-on        |
   |          (auth denials)        |
   +---------------+---------------+
                   |
            samples |
            reached |
                   v
   +-------------------------------+
   |  analysis service             |
   |  - minimum sample gate        |
   |  - relative comparison        |
   |  - one designated gate        |
   |  - three outcomes:            |
   |      promote | rollback | hold |
   |  - missing telemetry -> hold   |
   |  - bias toward rollback       |
   +---------------+---------------+
                   |
                   v
   +-------------------------------+
   |  decision                      |
   |  promote  -> route 100% v4     |
   |  rollback  -> route 0% v4      |
   |  hold      -> page a human,    |
   |               do not decide    |
   +-------------------------------+

   overlay: deploys, config changes,
   incidents on the same time axis
A sensible delivery checklist:
- Compute the analysis window from your request rate, your baseline error rate, and the smallest regression you want to catch. Write the number down; do not pick it by habit.
- Set a minimum sample size and refuse to decide before it is reached. Absence of errors is not health.
- Compare canary against control in the same window, never against a fixed absolute threshold.
- Designate exactly one gate metric. The rest are diagnostics.
- Add a separate never-worse-on guardrail for the paths that must not degrade.
- Allow a hold outcome, and make holding escalate to a human rather than defaulting to promote or rollback.
- Bias automated analysis toward rollback. A false positive is a wasted deploy; a false negative is an incident.
- Treat missing telemetry as inconclusive, never as a pass.
- Route stickily by user and make the same decision at every hop in the request path.
- Freeze other changes to the service during the canary where you can, and correlate deploys and config changes onto the analysis view where you cannot.
- Keep the control running for the entire window. It is the only guaranteed-clean baseline.
- Test the canary system with deliberately bad releases at known magnitudes. A gate that has never been shown to catch a real 2% regression is an assumption.
Common mistakes
| Mistake | What actually happens | Better decision |
|---|---|---|
| Absolute error threshold as the gate | Fires on a healthy canary, gets ignored | Compare against live control |
| Fixed 5-minute window | No statistical power on a low-traffic service | Compute the window from sample size |
| No minimum sample gate | Decides on 40 requests and calls it confidence | Require N samples before evaluating |
| Promoting on “hold” | Inconclusive results become silent approvals | Hold escalates to a human |
| Passing a canary with no telemetry | Missing data reads as success | Missing telemetry is inconclusive |
| Per-request routing | A user’s session spans two versions | Hash on user or session id |
| Re-rolling at each hop | The canary population is not the one measured | One consistent decision, propagated |
| All metrics are gates | Irrelevant fluctuations block every deploy | One gate, others diagnostic |
| No never-worse-on guardrail | Conversion improves, authorisation errors double | Separate guardrail metrics |
| Only error rate is a gate | Latency regressions ship routinely | Gate on latency p99 too |
| No freeze on other changes | A concurrent deploy is blamed on the canary | Freeze, and correlate on the timeline |
| Synthetic monitors routed only to canary | Either direction of false signal | Exclude or distribute them |
| Automated promote on a weak signal | Confident wrong answers at scale | Stronger evidence to promote than to roll back |
| Canary percentage fixed regardless of traffic | Low-traffic services get theatre | Scale percentage or mechanism to traffic |
| No rollback of the routing decision | A bad promotion is harder to undo than a bad deploy | Routing change reversible in seconds |
| Comparing against a stale dashboard baseline | A normal change looks like a regression | Control traffic in the same window |
| Canary of a 1-request-per-minute service | Zero detection power, false confidence | Dark launch, or validate another way |
| Ignoring metric instrumentation changes | Two different measurements compared | Human in the loop when telemetry changed |
| Deploying the new version and the metric together | Cannot tell which one moved the numbers | Change instrumentation separately |
The complete story in one minute
A canary is a controlled experiment, and the traffic split is the easy part. The hard part is a metric with enough statistical power to distinguish a small regression from noise, which is why the analysis window is a calculation rather than a habit: at 1,000 requests per second a 1% canary with a 10-minute window gives 6,000 requests, enough to see error rate move from 0.5% to 1.0%, while the same canary on a service doing 20 requests a minute cannot detect anything at all. Low-traffic services need a bigger percentage, a longer window, or a different mechanism entirely.
The gate has to be a comparison, not a threshold. An absolute error threshold fails on a service with a 0.8% baseline and gets ignored within a month, at which point the next real regression also passes. Comparing canary against live control in the same window absorbs baseline drift and hourly traffic-mix changes, and it is the reason the control is worth running — it is the only part of the system guaranteed to be on the old version, so it is the only baseline that survives whatever else changes during your 40-minute window.
Three requirements make the gate honest: a minimum sample size before it may fire at all, one designated gate metric with the rest as diagnostics, and a separate never-worse-on guardrail for paths like authorisation that must not degrade for a win elsewhere.
And automate the decision with a clear stance on error. A false positive costs a deploy; a false negative costs an incident. So allow a hold outcome that escalates to a human, require stronger evidence to promote than to roll back, and treat missing telemetry as inconclusive rather than as a pass — because a broken metrics pipeline that reports no data is the failure mode most likely to be promoted.
sticky split -> control comparison, same window
minimum samples -> one gate, one guardrail
promote | rollback | hold   (hold is a real answer)
The hard part was never splitting the traffic. It was building a metric that could tell a real regression from a Tuesday afternoon, and being honest when it could not.
Technical references
Related notes.
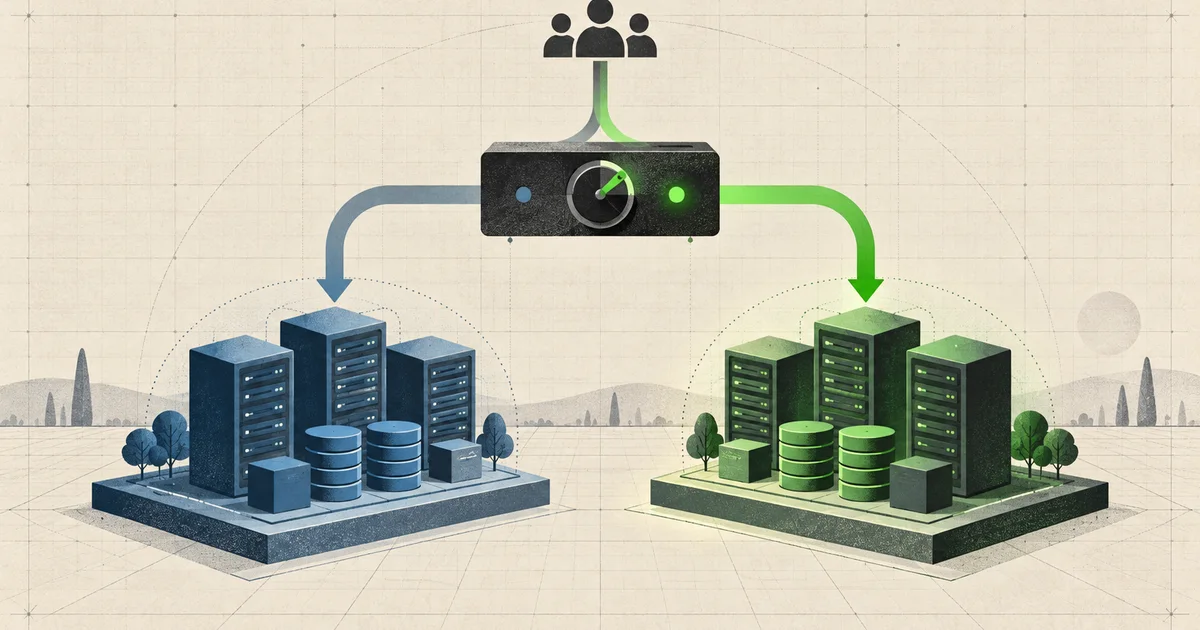
Blue-Green Deployment: The Deployment Where Your Rollback Plan Is a DNS TTL
Two identical environments, database migrations that break the contract, and the failure modes that turn a supposedly-safe switchover into an outage.
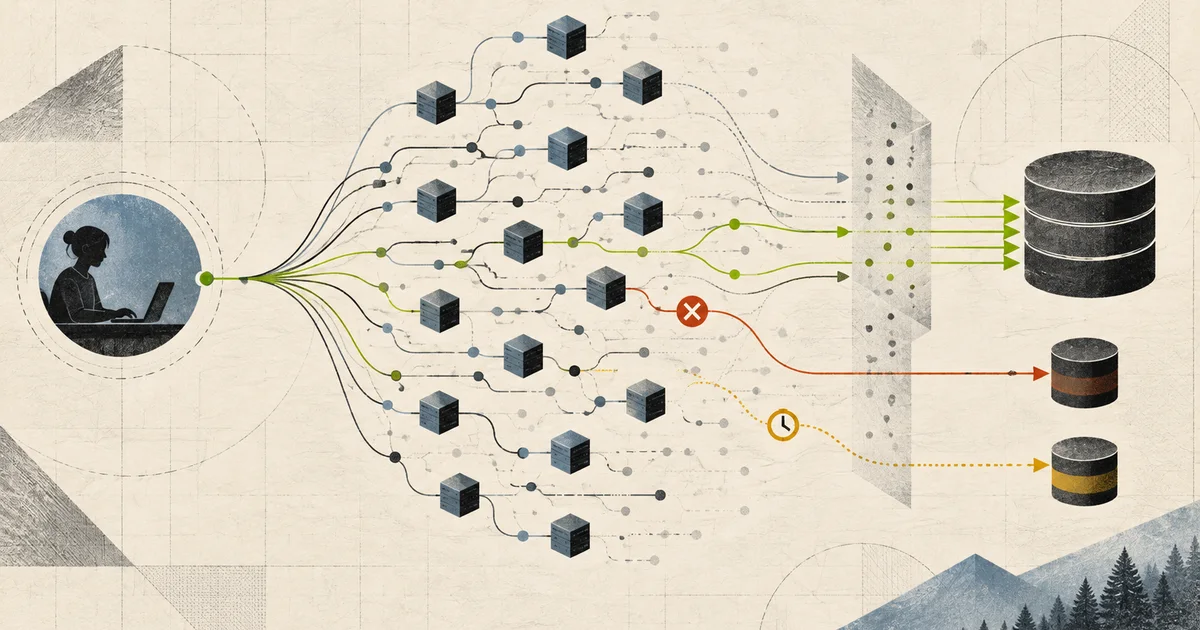
Distributed Tracing: You Cannot Sample 100% and You Cannot Store 100%
Spans, context propagation, head versus tail sampling, and the cardinality decisions that determine whether your tracing bill is a line item or an incident.

Travel Review Platform: Moderation, Fraud, and the Recency Problem
Running a travel review platform at scale — review eligibility, fraud detection, ranking that resists gaming, and the moderation workflow that makes it trustworthy.