Distributed Tracing: You Cannot Sample 100% and You Cannot Store 100%
Spans, context propagation, head versus tail sampling, and the cardinality decisions that determine whether your tracing bill is a line item or an incident.
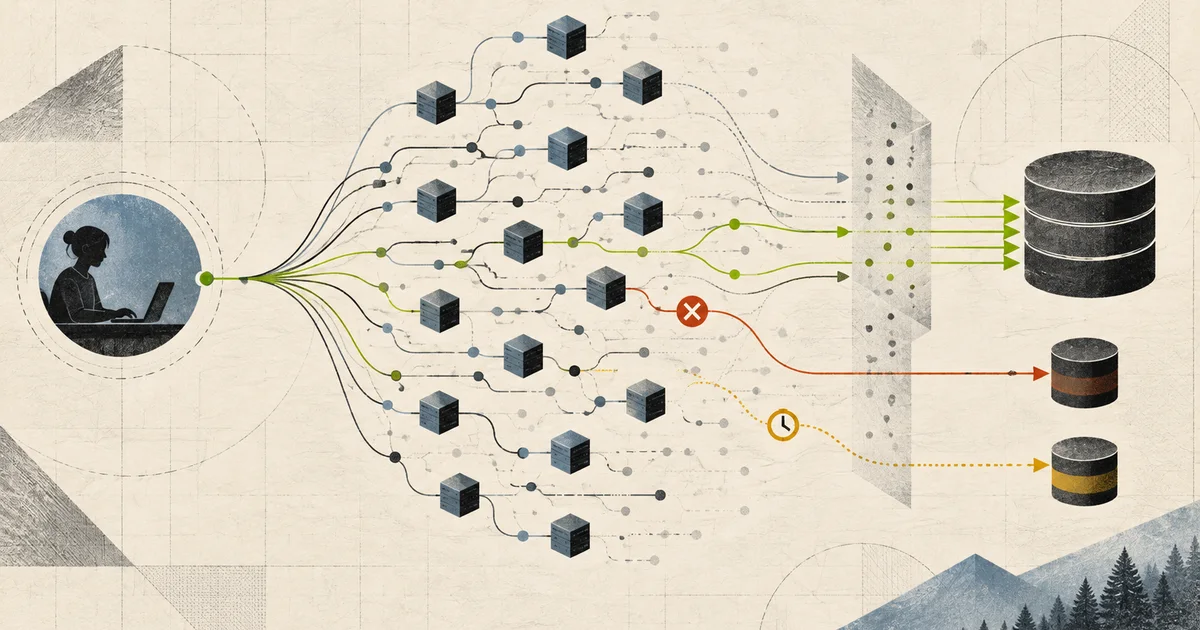
Every team that adopts distributed tracing makes the same discovery in the same week: the data is incomprehensibly valuable and impossibly expensive, and the mechanism that bridges those two facts is sampling. Then most teams pick a sampling strategy that is simple to implement and wrong for the problems they actually have.
The hard parts are the two decisions nobody makes explicitly — where the decision is made, and what “interesting” means — and both of them are design, not configuration.
The scale, and the bill
  2,000 services
  20,000 requests/sec
  = 20,000 traces/sec
  = 1.7 billion traces/day

  8 spans per trace (typical for a request
  crossing auth, gateway, 3 services, db, cache)
  = 13.6 billion spans/day

  ~500 bytes per span, with attributes
  = ~6.8 TB/day of raw span data

  sampling at 1%:
    17 million traces/day
    136 million spans/day
    ~68 GB/day
    ...indexed, with a retention window
Two numbers make the argument for sampling concrete. First, unsampled is 6.8 TB per day, which is not a storage problem, it is a different architecture. Second, 1% of 20,000 requests per second is 200 traces per second, and 200 traces per second is plenty to debug with — as long as they are the right 200.
The whole design question is how to make them the right ones.
The model: spans, context, and propagation
A span is one operation. A simple synchronous request is usually a tree of them, but distributed work is not always a tree. OpenTelemetry span links represent causal relationships such as batch consumption, retries, and fan-in where forcing one parent would throw information away.
  trace_id = 7f3a9c2e1b4d5a6f8c0d2e3f4a5b6c7d

  [api-gateway]  POST /checkout          180ms
   └─[authn]       verify token            12ms
   └─[inventory]   GET /stock/992         340ms
    ├─[postgres]    SELECT stock           8ms
    └─[redis]       GET stock:992          2ms
   └─[payments]   POST /charge          120ms
    ├─[http-out]     POST stripe/v1     110ms
    └─[postgres]    INSERT payment       15ms
   └─[events]     publish order.created  22ms
    └─[kafka]       produce                4ms
Spans carry a trace ID shared by the whole trace, a span ID unique to that span, and a parent ID pointing at the caller. Two mechanisms link them.
In-process parenting is implicit: a span created inside a call stack is a child of the active span. A thread-local or an async-context mechanism holds the currently-active span, and creating a span while one is active makes it a child.
Cross-process propagation is explicit and is the part that breaks.
  W3C traceparent header
    traceparent: 00-7f3a9c2e1b4d5a6f8c0d2e3f4a5b6c7d-4bf92f3577b34da6-01

    version(2) - trace-id(32 hex) - parent-id(16 hex) - flags(2)
    flags: 01 = sampled
An HTTP client copies the active span’s trace ID and its own span ID into the outgoing request, and the server on the other side reads the header, creates a span with that parent ID, and makes it the active span for everything it does. Async messages carry the same context in message headers. This is straightforward and it fails constantly.
Where propagation breaks, and what it costs:
| Break | Consequence |
|---|---|
| A client library that does not instrument | Orphan spans, no parent link |
| A queue consumer that does not read headers | Separate traces, no causal link |
| A service that overwrites instead of extending | Broken tree, wrong parent |
| A load balancer that strips unknown headers | Traces split at the edge |
| Retries that do not link | A retry looks like a separate request |
| Serverless that loses the context | Trace ends at the function boundary |
The last two deserve attention. A retry should be its own span with a link to the original attempt, not a fresh independent trace — otherwise a 3-retry request looks like three unrelated requests and the retry storm is invisible in the trace data. And an asynchronous boundary that loses context turns “user clicked and nothing happened” into two unrelated traces, which is the single most important question a trace system exists to answer.
The practical rule: any component that crosses a process boundary needs the context, and the components most likely to be forgotten are the ones nobody wrote by hand — third-party clients, generated stubs, message consumers, and anything crossing an API gateway.
Head sampling: cheap, and it misses the errors
Head sampling makes the decision at the start of the trace, at the entry point, before anything is known about how the request will go.
  incoming request
        |
        v
  +---------------------------+
  |  head sampler             |  deterministic on trace_id
  |  keep if                 |  -> 1% of traces, forever
  |    hash(trace_id) % 100   |  -> the same trace gets the
  |       < threshold         |     same decision in every
  +------------+--------------+     service (important!)
               |
        1% of requests get a trace
Its strengths are real: it is a single decision at one place, it reduces data volume at the source so the cost of the uninstrumented services is never paid, and it is trivially consistent.
Its problem is stated plainly in that pseudocode: 1% of errors is still 1% of errors. If the service takes 1,000 requests per second at a 0.1% error rate, that is one error per second, and at 1% head sampling you keep one error trace per 100 seconds. You will have a production incident, you will look at traces, and there will be nothing there. The head-sampled system reliably captures the errors that are not happening to anyone at the moment you are looking.
Determinism matters more than it looks. The sampler must make the same decision in every service, or a trace is kept by one service and dropped by the next, producing fragments. Hashing the trace ID achieves this: every service computes the same answer from the same input.
Tail sampling: right, and it constrains the architecture
Tail sampling buffers spans and makes the decision when the trace is complete, using what actually happened.
  policies (in priority order)

  1. errors          keep if status = ERROR
  2. slow            keep if duration > 2s
  3. specific route  keep if route = /checkout
  4. new deployment  keep if a deploy happened in
                     the last 10 minutes
  5. baseline        keep 1% of everything else
That policy is intended to keep failing requests, slow requests, critical business paths, extra samples around deploys, and a baseline for the normal case. It is not a lossless archive. Incomplete traces, collector restarts, memory pressure, decision timeouts, exporter failures, and policy mistakes can still discard the trace you wanted. Tail sampling improves the decision signal; it does not turn telemetry into an audit log.
The cost is architectural and it is not optional to understand:
All spans of a trace must reach the same decision point. Spans arrive at different collectors as the request progresses. If service A’s spans go to collector 1 and service B’s to collector 2, neither can see the whole trace, and neither can make the decision. This forces either a single collector endpoint for everything, or consistent routing of all spans in a trace to the same collector — which means the load balancer has to be trace-ID-aware.
The decision waits for trace completion. A collector must hold spans until it knows the trace is finished. “Finished” is a heuristic based on a timeout, because there is no end-of-trace signal. That timeout is a parameter that trades data completeness against memory, and a trace that exceeds it gets fragmented.
Memory is proportional to trace duration times throughput. At 20,000 requests per second with a 1-second trace duration, a 10-second completion timeout means roughly 200,000 traces in flight in one collector, each with several spans. That is a real memory footprint and it is the number to size collectors against.
  in-flight memory
    20,000 req/sec x 10s timeout = 200,000 traces
    x 8 spans x ~500 bytes       = ~800 MB
    ...plus indexes and overhead

  a collector that OOMs drops spans silently,
  and a dropped span is a broken trace
The instrumentation cost is paid before the decision. The application creates every span, serialises it, and sends it. Sampling reduces what is stored, not what is generated. This is the point people miss when they expect tail sampling to reduce application overhead: if the SDK overhead is a problem, sampling at the SDK level or using a lighter instrumentation approach is a separate decision.
The practical architecture that works: instrument everything, send everything to a small set of trace-ID-consistent collectors, buffer, decide, and forward only what survives. Some deployments instead use head sampling at a high rate — 15% rather than 1% — so that the interesting traces are far more likely to be captured whole, and accept the higher volume. That is a reasonable strategy when a trace missing one service is worse than a trace missing 85% of requests.
The tag and attribute decisions
Trace data is high-cardinality by construction, and this is where the cost hides.
  good attributes (bounded, low cardinality)
    http.status_code      20 values
    db.system             4 values
    service.version       bounded by deploy frequency
    retry.count           small integers

  dangerous attributes (unbounded)
    user_id              millions
    request_id           unique per request
    full URL with IDs    unbounded
    error message text    unbounded
    SQL statement         unbounded
Every distinct attribute value is a distinct time series in the storage backend. user_id as a tag does not make traces more useful in any way that matters — you already have the ability to search by whatever you tagged consistently — and it multiplies the index cost by the number of users.
The exception that is genuinely worth it: service.version on every span. It is low-cardinality and it lets you compare latency and error behaviour between a new deploy and the old one, which is the single highest-value query during a rollout.
error.stacktrace is worth its size, and error.message as a searchable index is often not — the full text is valuable in the trace detail view, the indexed version is valuable for grouping, and confusing the two is how you end up with an index that is too expensive to query.
Retention is a design decision. Thirty days of raw traces is expensive and mostly useless; seven days of high resolution plus a coarse rollup for a quarter is the pattern most teams settle on. Deciding at design time is better than discovering at renewal time, because by then you have dashboards depending on the data and cannot shorten it without breaking them.
Failure stories worth testing
Drop a queue consumer’s context
Confirm the produce and the consume land in separate traces. This is the most common propagation break and it makes async causation invisible.
Retry a request three times
Confirm the retries are spans linked to the original, not three independent traces. Otherwise a retry storm is invisible in the trace data.
Return 500s on one route for a minute and look at the traces
At 1% head sampling, confirm whether you found anything. If you did not, that is the argument for tail sampling, and it is worth demonstrating once.
Put a load balancer in front of the collectors without trace-ID affinity
Confirm traces fragment. This is the mistake that makes tail sampling look broken.
Make a trace take 30 seconds and set the collector timeout to 10
Confirm the fragment. Then find the slowest real request and set the timeout above it.
Add user_id as a span tag
Measure the index growth and the query latency. This is the cardinality test, and it is dramatic.
Kill a collector mid-trace
Confirm what happens to the in-flight spans. Silently dropped spans produce traces that are subtly wrong, which is worse than missing traces because they mislead.
Turn off the exporter entirely on one service
Confirm the traces from that service appear as gaps with a missing-span rather than silently vanishing. A gap tells you where the problem is; silence tells you nothing.
Burst to 10x normal traffic
Confirm collector memory holds. Tail sampling’s memory scales with in-flight traces, and a burst is exactly when you need the traces.
Set a 60-second tail-sampling timeout with 3-second traces
Confirm the cost of the extra 57 seconds of memory per trace. Over-provisioning the timeout is the easiest way to run out of memory on collectors.
Correlate a trace with a metric
Confirm you can go from an alert to the traces for the requests in that window. If not, the tracing system is an archive nobody can reach from the moment they need it.
A production-ready architecture
  2,000 services
  SDK: W3C traceparent, auto-instrumentation
  every client, consumer, and gateway propagates
        |
        v
  +---------------------------+
  |  ingress / mesh           |  injects or preserves
  |  traceparent              |  context at the edge
  +------------+--------------+
               |
        trace-ID-consistent routing
        (load balancer hashes on trace_id)
               |
               v
  +---------------------------+
  |  trace collectors (n)     |  all spans of a trace
  |  - buffer in memory       |  land on the same one
  |  - 10s completion timeout |
  |  - size for 20k x 10s     |
  |    in-flight traces       |
  +------------+--------------+
               |
               v
  +---------------------------+
  |  tail sampler             |  priority ordered
  |  1. status = ERROR       |  errors, always
  |  2. duration > 2s         |  slow, always
  |  3. critical route        |  business paths
  |  4. within 10m of deploy  |  extra around releases
  |  5. 1% baseline           |  the normal case
  +------------+--------------+
               |  ~1-5% survives
               v
  +---------------------------+
  |  trace backend            |  7 days full resolution
  |  - high-cardinality       |  90 days downsampled
  |    index, low-card tags   |  aggregate latency/errors
  |  - bounded attributes     |  per route per version
  +------------+--------------+

  metrics <-> traces: from an alert, jump to the
  traces for the same window and service
A sensible delivery checklist:
- Instrument the process boundary components first — HTTP clients, message consumers, API gateways, retry wrappers — because that is where propagation breaks and a broken context cannot be recovered downstream.
- Use W3C
traceparentand a deterministic head sampler keyed on the trace ID, so every service makes the same decision. - If you deploy tail sampling, put error policies first, route by trace ID, bound the buffer, and alert on dropped or timed-out decisions. Choose head sampling instead when source-side cost control matters more than post-hoc selection.
- Route all spans of a trace to the same collector, and verify the load balancer is trace-ID aware before you blame the sampler.
- Size collector memory from in-flight traces times timeout, and test a 10x traffic burst against it.
- Make retries and fan-out links rather than fresh traces, so amplification is visible.
- Tag
service.versionon every span; it is low-cardinality and it is the highest-value query during a release. - Ban unbounded attributes. Enforce it in the SDK wrapper if you can, because it will otherwise be added by one dependency.
- Set the completion timeout above your slowest real request, and accept the memory cost.
- Decide retention at design time: short full resolution, long downsampled. Check that nothing important depends on data you plan to drop.
- Wire the jump from an alert to the traces for the same window. A trace system nobody reaches from an alert is an archive.
- Measure the sampled trace rate against the traffic rate weekly. A silent exporter failure looks exactly like a low-traffic day.
Common mistakes
| Mistake | What actually happens | Better decision |
|---|---|---|
| 1% head sampling only | 1% of errors, and the error you need is missing | Tail sampling for errors and slow requests |
| Tail sampling without trace-ID affinity | Traces fragment, sampler decides on partial data | Consistent routing per trace |
| Completion timeout below slowest request | Fragmented traces, permanently | Timeout above the real maximum |
| Oversized completion timeout | Memory blows up under burst | Size from measured trace duration |
user_id as a span tag |
Index cost multiplies by user count | Bounded attributes only |
| Full error message indexed | Unbounded index, slow queries | Full text stored, bounded fields indexed |
| Head sampling decision made per service | Some services keep, some drop, fragments | Deterministic on trace ID |
| Uninstrumented message consumers | Produce and consume are separate traces | Instrument every boundary component |
| Retries as independent traces | Retry storms invisible | Spans linked to the original |
| No retention plan | Either too expensive or broken dashboards | Short raw, long downsampled, decided up front |
| Collecting every span forever | The bill arrives, then nobody queries | Sample with error and latency priority |
| No link from metrics to traces | Nobody finds the traces during an incident | Jump from alert to traces by window |
| One giant span for the whole request | No per-dependency latency | Span each meaningful operation |
| Assuming sampling reduces SDK cost | Instrumentation cost is still paid | Sample at the SDK, or accept the overhead |
| No deploy correlation in sampling | Releases under-sampled exactly when they matter | Extra sample within N minutes of a deploy |
| Per-service inconsistent attribute names | Cannot aggregate across services | A shared attribute convention, enforced |
| Silent exporter failure | Looks like a quiet day | Alert on export rate, not just error rate |
| Storing full SQL and URLs | Cardinality and PII problems | Statement shape, not bound parameters |
The complete story in one minute
A simple trace is a tree of parent-child spans joined in-process and, across processes, by W3C Trace Context carrying the trace and parent identifiers. Asynchronous batches, retries, and fan-in may need span links rather than a false single parent. Propagation is the part that breaks — third-party clients, message consumers, gateways, retry wrappers — and a missing upstream context cannot be reconstructed downstream, so those boundary components are the first thing to instrument.
The cost is the reason sampling exists. Head sampling decides near the entry point and can propagate that decision, sharply reducing collection work, but a uniform 1% policy also retains roughly 1% of rare errors. Tail sampling waits for more spans and can prefer errors, slow requests, critical routes, and deploy windows. The price is trace-ID-aware routing, buffering, decision latency, and failure modes where incomplete or evicted traces are still lost.
Tail sampling constrains the architecture in ways that are not optional: every span of a trace must reach the same collector, so the load balancer has to be trace-ID-aware; the decision waits for a completion timeout because there is no end-of-trace signal; and memory scales with in-flight traces times that timeout, roughly 800 MB for twenty thousand requests per second with a ten-second window. And sampling reduces what is stored, not what is generated — the application pays the instrumentation cost for every request.
Then the tag policy, which is where the bill hides. Unbounded attributes like user_id or raw error text multiply the index cost without making traces meaningfully more useful; service.version is low-cardinality and is the highest-value query during a release.
propagate context everywhere, or lose the tree
head sample deterministically on trace ID
tail sample by priority: errors, slow, critical, deploy window
size collectors from in-flight traces x completion timeout
The hard part was never recording the spans. It was deciding which of them to keep, and being honest that a 1% sample of a bad day is not observability.
Technical references
Related notes.
Canary Deployment: The Percentage of Your Users Who Find the Bug First
Weighted routing, metric gates that actually mean something, analysis windows versus sample size, and why most canary systems fail at the metric check.

Travel Review Platform: Moderation, Fraud, and the Recency Problem
Running a travel review platform at scale — review eligibility, fraud detection, ranking that resists gaming, and the moderation workflow that makes it trustworthy.
CockroachDB from First Principles: The Database That Refuses to Die
Why a global SQL database is really a problem of agreement and time, how Google solved it with TrueTime, GPS, and atomic clocks, and how CockroachDB reaches a practical design on ordinary infrastructure.