The N+1 in EF Core: Where It Comes From, How to See It, and How to Make It a Test Failure
The N+1 is not a slow query, it is a correct query repeated thousands of times, and because it works in development with ten rows the only reliable defence is a query count assertion in the test suite.
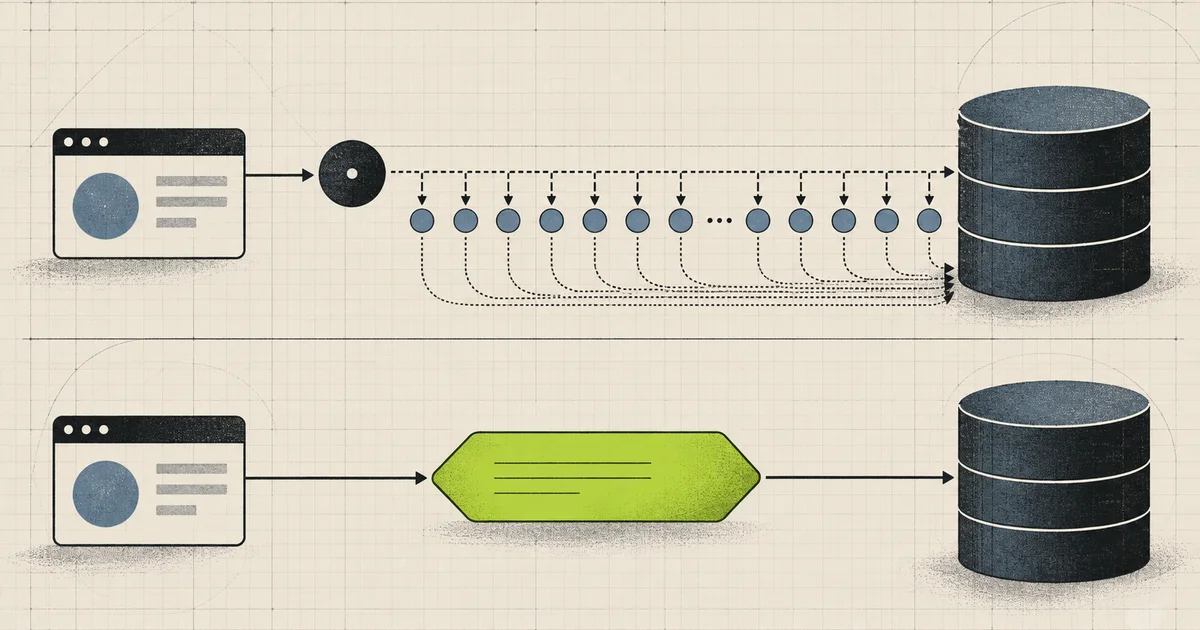
The N+1 is the most expensive query pattern that does not look like one. It is not a missing index and it is not a bad plan, and fixing either of those will not touch it. It is one correct query plus one more correct query per parent row, and the reason it reaches production is that it is correct, it is fast on small data, and it is invisible in every tool that reports on individual queries.
That invisibility is the whole problem, and it is also the reason a profiler will eventually point somewhere other than the database. After the loop is fixed the remaining question is how much of the latency was the network rather than the engine, and that is batching round trips. Before you fix it, note what the pattern does to connection pressure: the pool is sized for concurrency, not for query count, and the N+1 spends both. That arithmetic is in connection pool sizing. The reason the pattern survives in C# specifically is that the fix is often a cache in front of it, which has its own failure modes worth reading in an O(1) LFU cache in C#.
What it costs, with the arithmetic
var orders = await _db.Orders.ToListAsync(ct);   // 1 query, 25 rows

foreach (var order in orders)
{
    await _db.Entry(order).Collection(o => o.Items).LoadAsync(ct);
    var total = order.Items.Sum(i => i.Amount);  // 25 explicit loads
}
a page of 25 orders, 4 lines each
query 1 SELECT * FROM orders
queries 2-26 SELECT * FROM order_items WHERE order_id = ?
x25
total: 26 round trips
rows returned: 25 + 100Each of those twenty-five queries takes about a millisecond against a local database and is well indexed. The failure is entirely in the multiplication, and it is invisible in query logs because every individual query is fine.
  the same code, different data

    development,  10 orders  ->  11 queries  ->   11 ms
    staging,     200 orders  -> 201 queries  ->  201 ms
  production  5000 orders  -> 5001 queries -> roughly 5 s of DB latency
Those latency numbers are an illustration, not a capacity model. TLS, network distance, pool waits, server time, result size, and concurrency all move them. The invariant is the query count: it grows with the number of parents.
The three-second case is the one that produces the incident report, and it is also the one where the query log looks clean, because the log shows a thousand individual statements that each completed in under a millisecond.
A secondary cost is connection pressure. Unless you explicitly open a connection or transaction, EF Core normally opens and closes the connection around each operation; the loop therefore performs repeated pool checkouts rather than necessarily pinning one physical connection for the whole request. Under concurrency, either pattern consumes database capacity and can surface as pool waits or timeouts that distract from the multiplying query count.
Where it comes from in EF Core specifically
EF Core does not lazy load by default, which is a deliberate departure from its predecessor and worth stating plainly: if you have an N+1, something enabled it or something else is doing it. There are four realistic sources.
The proxies package. UseLazyLoadingProxies restores the old behaviour for virtual navigation properties.
options.UseLazyLoadingProxies();With it enabled, first access to an unloaded, overridable navigation can issue a query while the entity is attached to a live context. Without lazy loading, the same property access does not query. A collection may be empty, initialized, or already populated through relationship fix-up; a reference may be null. None of those states proves that the relationship is empty in the database.
Proxies are not the only switch. An entity can inject EF Core’s ILazyLoader (or its delegate), so an audit must search for both UseLazyLoadingProxies and lazy-loader injection.
A loop that calls the context directly. This is the version in the snippet above, and it is the one most teams write once and then never look at again, because it is written as a natural loop over results rather than as anything database-specific.
Property access after the query boundary. This one is subtler, because the code looks like the translatable projection above it. It becomes an N+1 only when lazy loading is configured; otherwise it produces incomplete navigation data rather than extra SQL.
// fine: everything the projection needs is resolved inside the SQL
var rows = await _db.Orders
    .Select(o => new OrderRow(o.Id, o.Number, o.Customer.Name, o.Items.Count))
    .ToListAsync(ct);
// dangerous: these accesses happen in memory. With lazy loading they can
// issue per-row SQL; without it they only see what is already loaded.
var orders = await _db.Orders.ToListAsync(ct);
var rows = orders
.Select(o => new OrderRow(o.Id, o.Number, o.Customer.Name, o.Items.Count))
.ToList();The two snippets are almost identical and have completely different query profiles. The difference is whether the property access happens inside the expression tree that EF translates, or in the memory of your process afterwards.
The one that surprises people. Returning entities from an API endpoint.
// what looks like a correct controller
[HttpGet("orders")]
public async Task<ActionResult<IEnumerable<Order>>> GetOrders(CancellationToken ct)
    => Ok(await _db.Orders.ToListAsync(ct));
One query happens in the controller. If lazy loading is configured, the context is still alive, and the serializer touches unloaded navigation properties, serialization can issue the rest. Remove any one of those conditions and the serializer does not query the database—although returning entities can still expose fields accidentally, produce cycles, or serialize incomplete relationships.
  a response, serialising 25 orders

    controller     1 query
    serializer     25 x customer
    serializer     25 x items
    serializer     25 x shipping address
    serializer      25 x payment method

    total          101 round trips, none of them in your code
This is why the fix is a DTO at the boundary rather than a query option. A projection returns a shape that has no navigations, so the serializer has nothing left to walk.
How to see it
Count commands at the request or use-case boundary. An interceptor makes that count assertable in tests; EF logs, OpenTelemetry spans, and an APM trace can reveal the same repeated statement in production.
public sealed class CommandCounterInterceptor : DbCommandInterceptor
{
    private int _count;
    public int Count => Volatile.Read(ref _count);

    public override InterceptionResult<DbDataReader> ReaderExecuting(
        DbCommand command, CommandEventData eventData,
        InterceptionResult<DbDataReader> result)
    {
        Interlocked.Increment(ref _count);
        return result;
    }

    public override ValueTask<InterceptionResult<DbDataReader>> ReaderExecutingAsync(
        DbCommand command, CommandEventData eventData,
        InterceptionResult<DbDataReader> result,
        CancellationToken cancellationToken = default)
    {
        Interlocked.Increment(ref _count);
        return ValueTask.FromResult(result);
    }

    public override InterceptionResult<int> NonQueryExecuting(
        DbCommand command, CommandEventData eventData,
        InterceptionResult<int> result)
    {
        Interlocked.Increment(ref _count);
        return result;
    }

    public override ValueTask<InterceptionResult<int>> NonQueryExecutingAsync(
        DbCommand command, CommandEventData eventData,
        InterceptionResult<int> result,
        CancellationToken cancellationToken = default)
    {
        Interlocked.Increment(ref _count);
        return ValueTask.FromResult(result);
    }

    public override ValueTask<InterceptionResult<object>> ScalarExecutingAsync(
        DbCommand command, CommandEventData eventData,
        InterceptionResult<object> result,
        CancellationToken cancellationToken = default)
    {
        Interlocked.Increment(ref _count);
        return ValueTask.FromResult(result);
    }
}
The async overrides are not decoration: ToListAsync, LoadAsync, and SaveChangesAsync do not pass through the synchronous callbacks. Production instrumentation should also cover the synchronous scalar callback if the application permits synchronous database access.
Register it per scope so the count belongs to one unit of work, and log the total on completion.
builder.Services.AddScoped(sp =>
{
    var counter = new CommandCounterInterceptor();

    sp.GetRequiredService<ICommandCounterHolder>().Counter = counter;

    return new AppDbContext(
        sp.GetRequiredService<DbContextOptions<AppDbContext>>(),
        counter);
});
// at the end of a request
app.Use(async (ctx, next) =>
{
await next();
var count = ctx.RequestServices
.GetRequiredService<ICommandCounterHolder>().Counter?.Count ?? 0;
logger.LogInformation("{Path} issued {QueryCount} queries", ctx.Request.Path, count);
});A number per endpoint is more useful than a number per query, because it turns the problem into a budget. Ten for a list endpoint with a couple of navigations is reasonable. A hundred is not, and you want to see that in a log line rather than discover it in a latency histogram.
Two cheaper signals are worth having first. Enabling the EF Core logging provider at Information for Microsoft.EntityFrameworkCore.Database.Command prints every statement, which is useful in a local reproduction but noisy at scale. AsNoTracking reduces change-tracker CPU and memory for read-only entity queries; it does not remove database commands, so it should not change the query count by itself.
The fixes, in order of preference
Project the shape you need into the query. This resolves the whole problem in one round trip and it is the default answer for read paths.
public sealed record OrderRow(long Id, string Number, string CustomerName, int ItemCount, decimal Total);

public async Task<IReadOnlyList<OrderRow>> GetAsync(CancellationToken ct)
    => await _db.Orders
        .AsNoTracking()
        .Select(o => new OrderRow(
            o.Id,
            o.Number,
            o.Customer.Name,
            o.Items.Count,
            o.Items.Sum(i => i.Amount)))
        .ToListAsync(ct);
AsNoTracking matters for a second reason: with tracking on, every returned entity is materialised into the change tracker, so a page of results that were only needed for display occupies identity-map memory for the rest of the scope. On a large read that is a measurable amount of memory and it is completely avoidable.
Include is the answer when you genuinely need entities rather than a projection.
var orders = await _db.Orders
    .AsNoTracking()
    .Include(o => o.Customer)
    .Include(o => o.Items)
    .ToListAsync(ct);
Compiled queries can help a measured hot path, and they are not an N+1 fix. They reduce EF’s query-compilation overhead; benchmark before accepting the extra code and version coupling.
private static readonly Func<AppDbContext, int, IAsyncEnumerable<Order>> _byId =
    EF.CompileAsyncQuery((AppDbContext db, int id) => db.Orders
        .AsNoTracking()
        .Include(o => o.Items)
        .Where(o => o.Id == id));

public async Task<Order?> GetAsync(int id, CancellationToken ct)
    => await _byId(_db, id).SingleOrDefaultAsync(ct);
The simpler prevention is architectural: do not configure proxies or ILazyLoader for API read models, and keep endpoint responses typed as DTOs. A repository check can reject those configuration markers without depending on EF Core internal option types.
AsSplitQuery, and the problem that comes with it
Include has a failure mode of its own, and it is the opposite of an N+1. Two collection navigations on one query produce a cross product.
-- Include(o => o.Items) and Include(o => o.Shipments), one query
SELECT o.*, i.*, s.*
FROM orders o
LEFT JOIN order_items i    ON i.order_id  = o.id
LEFT JOIN shipments     s  ON s.order_id  = o.id
An order with 4 items and 3 shipments produces twelve rows, and EF discards eleven of them while paying for them in network transfer, materialisation, and identity map.
  25 orders, 4 items each, 3 shipments each

    single query:  25 x 4 x 3 = 300 rows
                   of which 100 are items and 75 are shipments
                   repeated order/item/shipment values are transferred

    split queries: 25 x 1 + 100 x 1 + 75 x 1 = 200 rows
                   and 3 round trips
AsSplitQuery gives you the second shape. EF Core uses single-query mode by default unless you configure another behavior, and warns when it detects multiple collection includes without an explicit choice. Make that choice in code or context configuration instead of relying on a remembered version default.
var orders = await _db.Orders
    .AsNoTracking()
    .AsSplitQuery()
    .Include(o => o.Items)
    .Include(o => o.Shipments)
    .ToListAsync(ct);
The cost of a split query is that it is no longer a consistent snapshot. The three statements can see three different points in time, so a row updated between the first and the third can appear in an inconsistent combination. Under a read-committed default that is a real possibility and it is worth knowing about when you choose split over single.
  single query   1 round trip, one snapshot, possibly a cross product
  split query    one statement per included collection, no cross product;
                 consistency across statements requires a suitable transaction
  projection     1 round trip, no tracking, no navigation to walk
The ordering matters: a projection avoids the whole debate, and you should reach for Include when you need entities.
Bounding the round trips
The durable change is to make the number of queries a property of the test rather than a property of a code review, because this defect is introduced by a line that looks like nothing.
public sealed class QueryBudgetTests : IClassFixture<AppDbContextFactory>
{
    [Fact]
    public async Task Order_list_endpoint_issues_one_query()
    {
        var (db, counter) = AppDbContextFactory.CreateWithCounter();
        await SeedAsync(db, orders: 200, itemsPerOrder: 4);

        var rows = await new OrderQueries(db).GetAsync(CancellationToken.None);

        Assert.Equal(200, rows.Count);
        Assert.Equal(1, counter.Count);
    }

    [Fact]
    public async Task Order_detail_endpoint_issues_two_queries()
    {
        var (db, counter) = AppDbContextFactory.CreateWithCounter();
        await SeedAsync(db, orders: 200, itemsPerOrder: 4);

        await new OrderQueries(db).GetDetailAsync(88123, CancellationToken.None);

        Assert.True(counter.Count <= 2,
            $"expected at most 2 queries, got {counter.Count}");
    }
}
Seed the test with more rows than you think you need. A budget test over three rows passes against a query that is still an N+1, because three rows means four queries and the assertion is on a count, not on a shape. Two hundred rows makes the same code fail the assertion immediately.
The seeded data does not have to be expensive. Generating two hundred orders in memory is milliseconds, and the assertion is what catches the regression, not the volume.
Once the budget exists, the interceptor counter can also be exported as a metric, and an alert on the p99 of queries-per-request will find every N+1 introduced by a future change to a service that has instrumentation and none introduced to a service that does not.
A production-ready architecture
  a request that reads the database
        |
        v
  +--------------------------------------+
  | does the endpoint return a DTO?     |
  +--------------------------------------+
     | yes                          | no, returns entities
     v                                v
  one projection query          the serializer will walk
  asNoTracking                  the navigation properties
  no navigation to walk                |
  1 round trip                        v
                                 project to a DTO anyway
                                         |
                                         v
  +----------------------------------------------+
  | query budget asserted in tests, seeded with   |
  | enough rows that an N+1 fails the count       |
  | command counter exported as a metric          |
  | lazy loading asserted to be off              |
  +----------------------------------------------+
A delivery checklist:
- Return projections from endpoints rather than entities, so the serializer has no navigations to visit.
- Add
AsNoTrackingto read-only entity queries to remove identity-map work; it does not change the generated SQL merely by being present. - Keep both
UseLazyLoadingProxiesandILazyLoaderout of API read models, and enforce that boundary in tests or architecture rules. - Check where property access happens relative to the query boundary. Inside a
Selectis translated; outside it is a round trip. - Count commands with an interceptor, log the count per request, and treat a rising number as a regression.
- Assert a query budget in tests, seeded with a few hundred rows rather than three.
- Use
AsSplitQueryfor multiple collection includes, and accept the snapshot inconsistency consciously. - Prefer a projection to
Includefor read paths; a projection does not need the split decision at all. - Add
EF.CompileAsyncQueryfor hot repeated shapes, recognising that it saves translation cost rather than round trips. - Watch pool wait time and database command spans; an N+1 repeatedly consumes connection and server capacity, and an explicit transaction can pin a pool slot for the entire loop.
Failure stories worth testing
Loop over two hundred rows and count the commands
The assertion fails immediately, and it is far more persuasive than a latency comparison because the cause is right there in the number. This is the repro to run before proposing any fix.
Return entities from a controller and count the queries in the response
With lazy loading enabled and the context alive, one query in the controller can become hundreds during serialization. Repeat the test with lazy loading disabled: query count stays flat, proving the missing precondition rather than blaming JSON itself.
Move property access from outside the query into a Select
Same code, one query instead of many. The comparison makes it obvious that the fix is about where the expression tree ends rather than about the query itself.
Add a second collection Include and watch the row count
The row count multiplies and most of it is discarded. It is the clearest demonstration of when AsSplitQuery is the right call, and it is the opposite failure from an N+1.
Add AsNoTracking to a large read and compare memory
The identity map stops growing for rows that were only read. On a page of a few thousand entities the difference is visible in the process, and it is a free change.
Common mistakes
| Mistake | What actually happens | Better decision |
|---|---|---|
| Judging the query on one row at a time | Every individual query is fast and correct | Count the round trips, not the latency |
| Reviewing the code, not the request | An N+1 is written as a natural loop | Assert a query budget in tests |
| Assuming EF Core lazy loads | It does not by default | Find proxies, ILazyLoader, or explicit loads |
| Returning entities from an endpoint | With lazy loading and a live context, serialization may query; otherwise it still leaks persistence shape | Project to a DTO |
| Reading a navigation after the query | It queries only if lazy loading is configured; otherwise it may be incomplete | Access needed data inside Select |
| Testing with three rows | An N+1 over three rows is four queries and passes | Seed a few hundred rows |
Adding a second collection Include |
A cross product, more rows transferred, then discarded | AsSplitQuery, or project instead |
| Believing a split query is free | It is several snapshots, not one | Accept the inconsistency consciously |
| Keeping tracking on read paths | Every row occupies the identity map | AsNoTracking |
| Fixing it with an index | The queries are already indexed and still numerous | Reduce the number of queries |
| Adding retry on the timeout | Retries re-run the N+1, multiplying it | Bound round trips, then look at the pool |
| Assuming a query log will reveal it | A thousand fast statements look healthy | Count and budget them |
The complete story in one minute
An N+1 is not a slow query, it is a correct query repeated once per parent row, and the reason it reaches production is that it is correct, it is fast on small data, and every tool that reports on individual queries shows you a thousand statements that each completed in under a millisecond. Ten rows means eleven queries and no visible problem. Five thousand rows means five thousand and a five-second request that holds a connection the whole time, which is why the first symptom is often a pool timeout that points at the pool rather than at the code.
EF Core does not lazy load by default, so an N+1 has a concrete trigger: proxies or ILazyLoader, explicit loading inside a loop, or repeated context queries. Returning entities lets a serializer become that trigger only when lazy loading is active and the context is still alive. The fix follows from which trigger exists, and the best read-path default is a DTO projection: it selects the required columns, leaves no navigation for the serializer to traverse, and avoids tracking and split-query decisions.
The durable change is a test rather than a convention. Count synchronous and asynchronous commands with a DbCommandInterceptor, assert a budget, and seed enough parent rows that a linear query count cannot hide. Export the count or command spans in production so the regression appears as repeated database work instead of a slow Tuesday. And remember the opposite failure: sibling collection Includes in one query can produce a cross product. AsSplitQuery trades that multiplication for multiple statements and round trips; if one consistent view is required, choose an appropriate transaction or a different projection deliberately.
Technical references
Related notes.
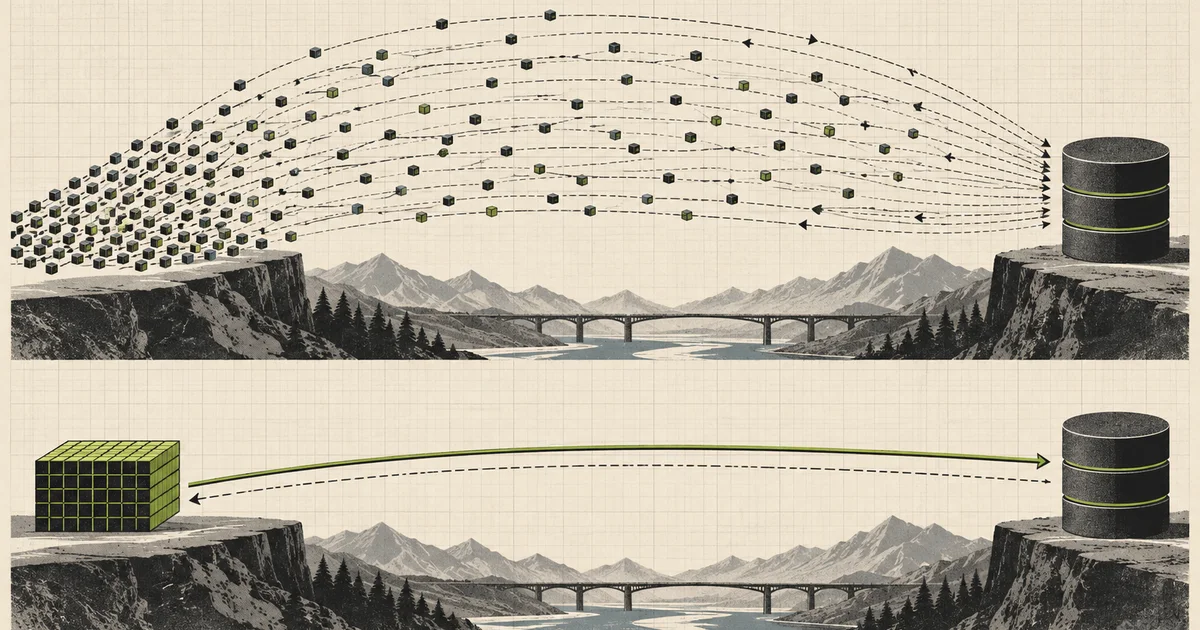
Batching: Turning a Thousand Round Trips Into One
How to remove database round trips without confusing batching, transactions, preparation, concurrency, and bulk-loading behavior in Npgsql and PostgreSQL.
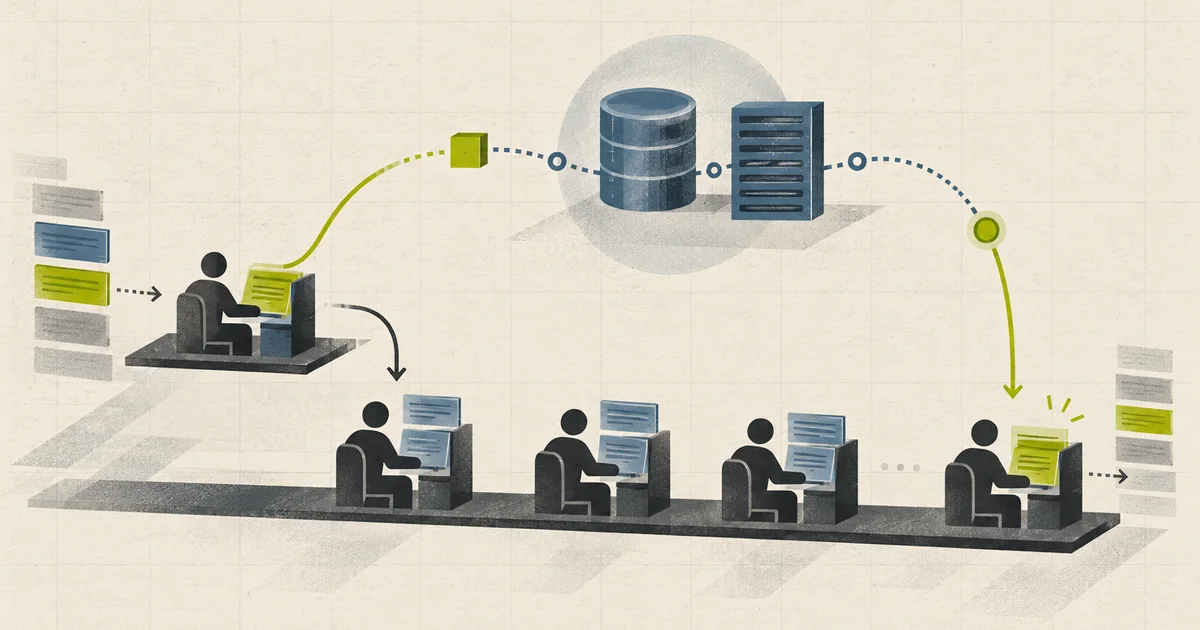
How Async and Await Work in C#
A story-led explanation of Tasks, compiler-generated state machines, continuations, threads, I/O completion, exceptions, cancellation, contexts, and practical async design in .NET.

Connection Pool Sizing: Little's Law, max_connections, and the Multiplication Nobody Budgeted
How many database connections you actually need is arithmetic, not intuition, and the real risk is that your pod count multiplies a per-instance default into more connections than Postgres has.