LSM Compaction: The Background Job That Becomes a Foreground Outage
Why an LSM engine saturates a disk with no user traffic, how write stalls turn a background merge into a latency incident, and why the disk needs headroom a capacity graph will never show.
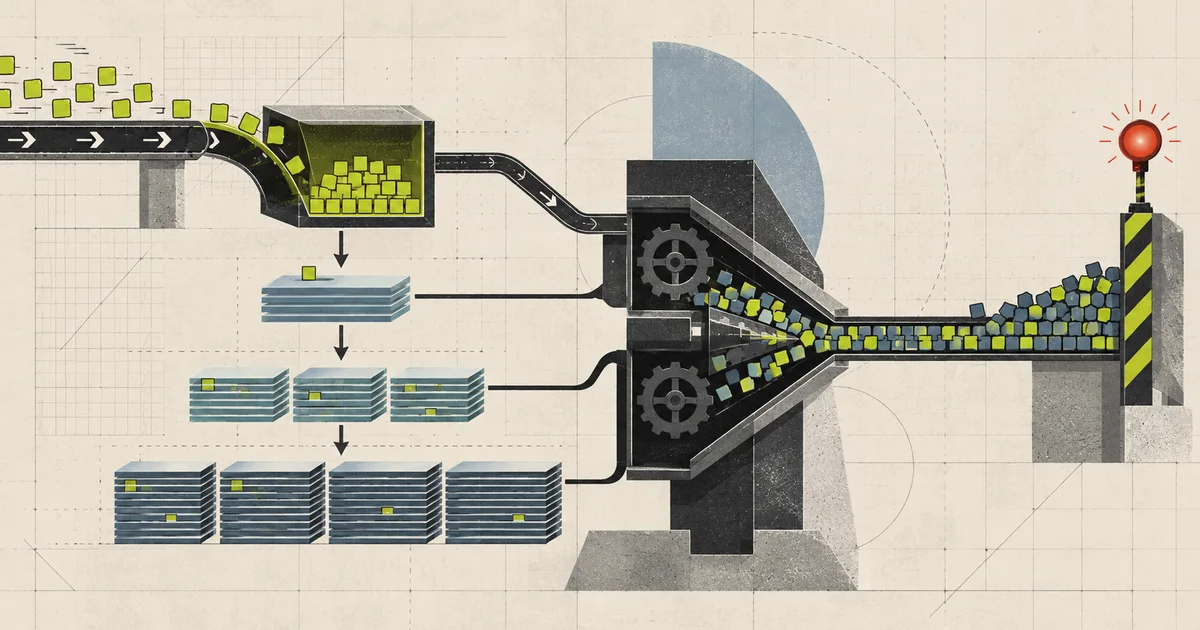
Nothing is happening. The dashboard shows the same request rate as an hour ago, and there are no deploys, no batch jobs, and no traffic spike. Then p99 climbs, then the write path starts returning errors, and the on-call engineer finds that the disk is at ninety-five percent and the compaction queue is eleven hours behind.
The background job was never the safe part.
The reason the compromise is unavoidable rather than a tuning failure is set out in the RUM conjecture and storage trade-offs. If you are choosing the engine, that argument is the one to read first, because a compaction stall is the bill coming due for a decision you made at design time.
What compaction actually does
An LSM engine writes to a memtable in memory. When the memtable fills, it is flushed to disk as a sorted run, which is a sequential write and is therefore cheap. The problem is that the disk now holds many overlapping runs and a lookup has to check all of them.
  L0 (newest, overlapping)     L1              L2 (oldest)
  +--------+ +--------+       +--------+      +---------------------+
  | run 9  | | run 7  |       | run 3  |      | many non-overlapping|
  +--------+ +--------+       +--------+      +---------------------+
        |         |                 |
        +---------+--------+--------+
                          |
                   keys are scattered
                   across every run
Compaction merges runs to reduce that scatter. It reads a set of inputs, merges them, and writes one output. The output is smaller in aggregate because the input runs duplicated keys.
That read and rewrite is the bill. Its size is workload- and policy-dependent: key distribution, deletes, value size, compression, level ratio, and compaction style all change write amplification. “Ten times” can be a useful observed value, but it is not an LSM constant; measure device bytes written per logical byte ingested.
Now the two things that follow from “compaction has to keep up”:
- Read amplification is only bounded because compaction removes overlapping runs. If it stops, the number of runs a lookup must check grows without limit.
- So the engine cannot simply let compaction fall behind. It has to stop accepting writes instead.
The three thresholds, and what happens at each
The mechanism is a set of escalating responses, and the interesting detail is that the first one is nearly invisible.
level-0 file count

  4    compaction triggered
  ...  nothing user-visible

  20   slowdown    foreground writes are delayed
                  -> request latency rises before any error

  36   stop        writes are rejected
                  -> the application sees failures
Those are recognizable RocksDB-style values, not a portable contract. Defaults change, managed products hide or replace the controls, and other LSM engines expose different pressure signals. The reusable shape is escalation: schedule more compaction, delay writes, then stop writes when allowing the backlog to grow would make recovery worse.
The gap between the slowdown and the stop is where an outage is born. At twenty level-0 files every write is being delayed by compaction pressure, so latency is already degrading while every metric that counts errors still reads green. The stop threshold arrives later, with an error rate spike, by which point the queue is too deep to recover in time.
There is a second set of limits for the same reason, on the amount of compaction work waiting rather than the number of files. A soft limit starts slowing foreground writes to keep the backlog bounded, and a hard limit stalls the write path. In a write burst that is faster than compaction can drain, the soft limit is often the first thing that fires, and it is the one that shows up as unexplained latency.
The uncomfortable part is that the stall is not a bug. It is the engine trading write availability for a bounded read cost, deliberately, and the setting you want depends on whether the workload can absorb a stall or cannot.
How a background job becomes a foreground incident
Walk the causal chain, because each step is separately observable and the first three are routinely missed.
1. write rate rises, or compaction throughput falls
2. level-0 file count climbs past the slowdown threshold
3. foreground writes are delayed                    <- latency, no errors
4. a long compaction is queued behind a short one
5. pending compaction bytes keep growing
6. the soft byte limit fires
7. write stalls become continuous
8. clients time out and retry
9. the retries are writes, and they arrive at a stalled engine
10. the queue never drains
Step three is where a postmortem usually starts looking, and it is the point at which the incident is already a minute old.
Step eight is what turns a slowdown into an outage. A client that gets no response in two hundred milliseconds will not wait. It retries, possibly with a different backoff or a different endpoint, and every retry is another write against an engine that is already refusing to accept them. A well-behaved client with exponential backoff and jitter survives this. A naive retry loop makes it monotonically worse, and the correlation between the stall and the retry storm is the signature of this failure.
The most common trigger is not a traffic spike at all. It is a bulk operation: a backfill, a migration, a reindex, a log shipper catching up after an outage, or a cleanup job that writes in a tight loop. Those write at a rate nothing in the steady-state model anticipated, and they are usually scheduled precisely when the cluster is quiet, which is exactly when nobody is watching.
The feedback loop is the outage
Compaction falling behind is bad. Compaction falling behind because reads got slower is a different and much worse problem, because the loop closes on itself.
  compaction behind
        |
        v
  more level-0 runs
        |
        v
  every read probes more runs
        |
        v
  read latency rises
        |
        v
  clients retry / requests hold connections longer
        |
        v
  more concurrent writes against the same engine
        |
        v
  compaction further behind
        +------------------------------------------
Bloom filters blunt negative point lookups by avoiding many table reads. They do not rescue range scans, and a positive or false-positive probe still reaches the index/data blocks; “without a Bloom filter every run is fully scanned” is not how an SSTable lookup works. Treat filters as a workload decision, then measure their memory cost and false-positive rate.
The other accelerant is hardware contention. Compaction is sequential and it is saturating the disk, so the foreground reads and writes are queueing behind it on the same device. A volume provisioned for steady-state request traffic does not have spare IOPS for ten times the write volume that compaction adds. This is the same class of mistake as sizing a database instance for its queries and not for its background work, and it is why a cluster that survives a load test can fall over on a Monday.
Disk headroom is not optional
A compaction reads selected inputs and writes outputs while the inputs remain live. Temporary space therefore tracks the selected job, not automatically the entire database. A universal/tiered major compaction can approach another copy of the live data; leveled compaction usually rewrites overlapping subsets, though concurrent jobs and safety margins still require headroom.
  selected inputs       400 GB
  output being written  up to roughly 400 GB before old inputs are removed
  ---------------------------------------------
  peak requirement      800 GB  against a 400 GB dataset
So a dataset well below the volume size can still fail a large compaction. There is no universal “forty percent safe” or “eighty percent cliff”: derive the margin from the engine’s compaction style, maximum concurrent job size, snapshots, tombstones, and recovery behavior, then verify it with a forced compaction on a production-shaped copy.
This is the failure that looks like a capacity problem and is treated as one, which is why it recurs. A capacity dashboard built on average utilisation shows a number that has been creeping up for weeks and no cliff. The cliff is the merge that could not allocate its output, and the disk has been nearly full for a month.
The allocation failure is also self-reinforcing in a bad way. A failed merge leaves its inputs in place, the queue does not advance, and the space it needed is still consumed by the inputs that were supposed to be freed. Recovering usually means either dropping data or raising the volume ceiling, and neither is something you want to be doing during an incident.
Alerting on lag, not on throughput
Throughput tells you what compaction is doing now. Lag tells you whether it will still be behind in an hour, which is the number that is worth paging on.
  alert if level0 file count > 20 sustained for 5 minutes
  alert if pending compaction bytes > soft limit
  alert if compaction bytes/second < write bytes/second
  alert if disk utilisation > 70%
  alert if write stall count increased
The third one is the most useful and the least commonly present. Comparing compaction throughput against the current write rate tells you directly whether the queue is growing, and it is early enough to act on. The others are all consequences of it.
Two metrics that are routinely collected and routinely useless: average compaction latency, which is dominated by a long tail of large merges, and total bytes compacted, which rises on a healthy system and on a sick one identically. Neither distinguishes keeping up from falling behind.
Disk utilisation belongs on the same page rather than in a separate capacity report. Seventy percent is a warning because it removes the headroom that compaction needs, and the number that matters is instantaneous peak during a merge rather than the daily average.
A production-ready architecture
  foreground writes
        |
        v
  +--------------+   stalls detected   +-------------------+
  | memtable     | -----------------> | shed load, 429    |
  | buffer pool  |                    | do NOT queue      |
  +--------------+
        | flush when full, unless stalled
        v
  +--------------+   L0 count rising    +-------------------+
  | L0 files     | -----------------> | compact harder    |
  +--------------+                    +-------------------+
        | compaction consumes IO
        v
  +--------------------------------------------------------------+
  | device: provision for query IO *plus* write amplification     |
  | volume: live data + worst selected outputs + recovery margin   |
  +--------------------------------------------------------------+

  +--------------------------------------------------------------+
  | never run backfills on the volume with no headroom            |
  | never queue on a stall: shed, because the queue cannot drain   |
  +--------------------------------------------------------------+
A delivery checklist:
- Set the slowdown threshold deliberately and alarm on it. Waiting for the stop threshold means accepting the outage.
- Size the volume from the worst concurrent compaction outputs plus snapshots and recovery margin. Reserve near-2x only where the chosen style can actually rewrite most of the dataset at once.
- Alarm on pending compaction bytes, and alarm on compaction throughput against write throughput, which is the earliest reliable signal.
- Set a disk-utilization threshold from that tested space model, measured at merge peaks rather than daily averages; do not copy a universal seventy-percent rule.
- Provision device bandwidth for foreground IO plus measured compaction read/write amplification, not a memorized multiplier.
- Never queue writes when the engine stalls. A queue in front of a stall does not drain and converts a slow system into an unbounded memory problem.
- Rate-limit bulk jobs, backfills, and migrations, and run them against a cluster with headroom rather than the production volume at 3am.
- Make retries exponential with jitter, and cap them, before you need them. The retry storm is the difference between a slowdown and an outage.
- Size Bloom filters for point-lookup workloads and monitor false positives. They help file avoidance; they do not remove range-read amplification.
- Record the stall count as a first-class application metric. A client library that does not see stalls will not show you the latency they caused.
Failure stories worth testing
Stop compaction on a loaded cluster and watch writes stall
In a staging environment with a real dataset, disable or heavily limit compaction and write continuously. Watch latency rise before any error appears, then watch the stall threshold reject writes. The gap between “latency is bad” and “writes are rejected” is the entire detection window you are relying on.
Fill a volume to ninety percent and force a large merge
The merge fails on space rather than on time, and the inputs stay put, so the queue does not advance. This reproduces the recurring “we are only at ninety percent” outage, and it is much easier to diagnose once you have seen it happen on purpose.
Run a backfill at full write speed on a quiet cluster
Write as fast as the cluster accepts for an hour and watch the level-0 count and the pending bytes. A cluster that handles production traffic fine will usually fall over here, because the bulk job is the load the sizing never accounted for.
Turn off bloom filters and measure read latency at twenty level-0 files
The jump is dramatic and it explains why read latency degraded before any write metric moved. This is also the test that justifies treating bloom filters as required rather than tunable.
Compare compaction bytes per second to write bytes per second under a real write load
If compaction is not consistently ahead, the queue grows and no threshold has fired yet. Watching that ratio over ten minutes is the closest thing to a leading indicator that an LSM engine offers.
Common mistakes
| Mistake | What actually happens | Better decision |
|---|---|---|
| Alarming on the stop threshold | Outage before the page, because slowdown came first | Alarm on the slowdown threshold and pending bytes |
| Sizing the volume from live bytes alone | Selected inputs and outputs coexist during compaction | Model the largest concurrent jobs and snapshots |
| Provisioning IOPS for queries only | Compaction consumes device bandwidth and can starve the foreground | Budget query IO plus measured amplification |
| Queuing writes when the engine stalls | The queue cannot drain and memory becomes the next incident | Shed with 429 and fail fast |
| Running a backfill on the production volume at night | Bulk writes are the load the sizing never modelled | Throttle bulk jobs, use a separate cluster |
| Viewing compaction as deferrable housekeeping | Read amplification is unbounded without it | Treat compaction lag as capacity |
| Retrying writes without backoff | A retry storm feeds the stall that caused it | Exponential backoff with jitter and a cap |
| Treating Bloom filters as magic | They help negative point lookups, not range scans | Tune bits/key and watch false positives |
| Alerting on average compaction latency | Dominated by a tail of large merges, says nothing about backlog | Alert on pending bytes and throughput ratio |
| Watching daily average disk utilisation | Peaks during merges are what fail | Watch merge-time peak against a tested margin |
| Assuming no user traffic means no writes | Catch-up shippers, vacuum, and backfills all write | Alert on the write rate, not the request rate |
| Trusting vendor write amplification numbers | Ratios vary by workload and level count | Measure bytes written per byte ingested |
The complete story in one minute
An LSM engine buffers writes in a memtable and flushes sorted runs. Those runs overlap, so reads may consult several of them, and compaction is what bounds that amplification and reclaims obsolete versions. The rewrite cost is not a universal multiplier: it belongs in a measurement from the actual engine and workload. Engines commonly respond to backlog in stages—schedule more work, delay foreground writes, then stop them—and the latency-only stage is the detection window most teams miss.
The failure compounds because of a loop rather than a single cause. Compaction falls behind, level-0 runs accumulate, every read probes more files, read latency rises, clients hold connections longer and retry, and the retries are additional writes arriving at an engine that is already stalled. Bloom filters are what keep that loop slow, and sustained disk contention between compaction and foreground IO is what starts it early.
Two operational conclusions follow. Space must cover live data, the largest plausible concurrent outputs, snapshots, and recovery margin; a universal major compaction and a leveled subset compaction do not need the same reserve. And pending compaction bytes, L0 pressure, stall time, and device bandwidth must be read together. A throughput ratio is useful only when numerator and denominator use comparable bytes and windows. Compaction is not free background housekeeping. It is part of the foreground capacity model even when it runs on background threads.
Technical references
Related notes.
fsync: The Flush Between a Commit and Stable Storage
How PostgreSQL separates writes, WAL flushes, synchronous commit, hardware truthfulness, and group commit—and where each durability promise can fail.

The RUM Conjecture: Read, Update, and Memory Amplification
The RUM conjecture frames an access method as a trade among read overhead, update overhead, and memory or storage overhead—not as a theorem about range scans.
Read Replicas: The Right Answer, the Wrong Moment, and How to Keep Users From Seeing It
Asynchronous replication separates primary commit, standby receipt, durable flush, and replay. Read-your-writes depends on replay; failover loss depends on what reached the promoted standby.