Monitoring and Alerting: Why Your Alerts Are Noisy and Your Outages Are Not Caught
Prometheus pull semantics, cardinality, recording rules, alert routing with inhibition, and the difference between a metric that explains an incident and one that pages someone.
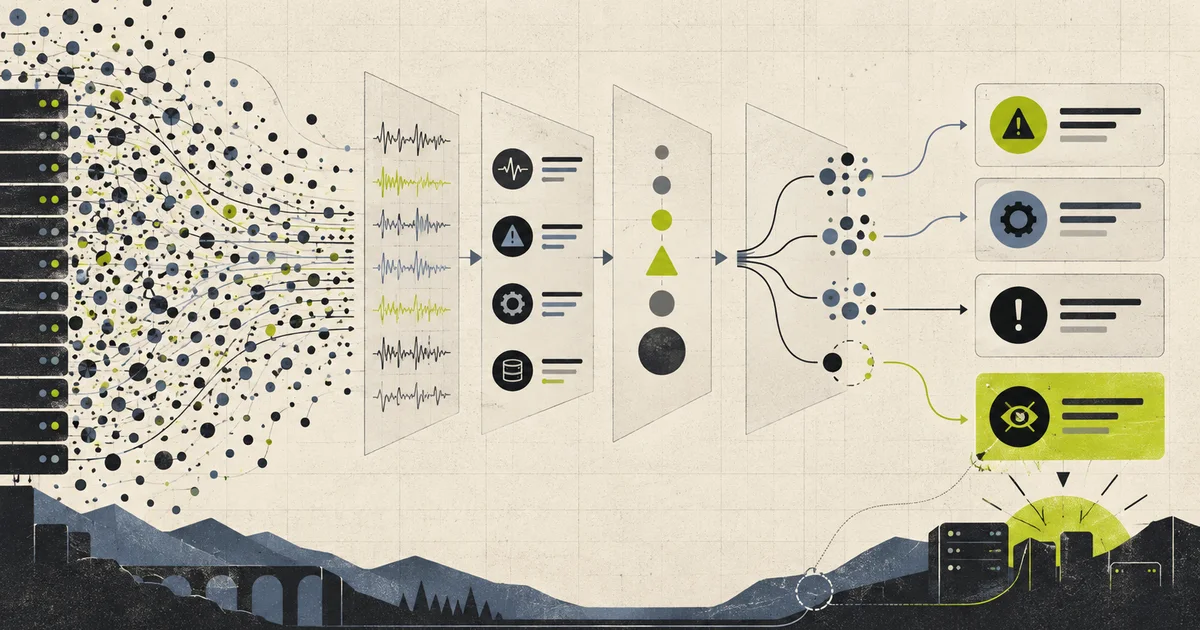
Almost every platform has the same two problems at once: too many alerts nobody acts on, and a small number of incidents nobody was told about. These are not independent problems. They have the same cause, which is that the metrics describe the system rather than the experience, and the alerting rules are written against the metrics.
The fix is not fewer alerts by arbitrary decision. It is a deliberate separation between what you measure, what you record, what you page on, and what you look at when something is already wrong.
The scale
  2,000 microservices
  x 8 instances each
  = 16,000 scrape targets

  scrape interval 15s
  = 16,000 / 15 = ~1,067 scrapes/sec
  = ~92 million scrapes/day

  500 metrics per target
  = 8 million active series

  cardinality is the real number:
  8M series x ~2 bytes/series
  ~16 bytes/sample in RAM
  = ~1.3 GB just for the head block
  ...plus WAL, plus compaction, plus TSDB files
  -> a single Prometheus cannot hold this
The number that actually determines whether Prometheus works is cardinality, which is the count of unique label-value combinations across all series.
  series = metric_name x all label combinations

  http_requests_total
  {method="GET",   status="200",  route="/a", instance="i1"}   series 1
  {method="GET",   status="200",  route="/a", instance="i2"}   series 2
  ... 200 routes x 8 instances x 6 methods x 8 statuses
  = ~77,000 series for one metric, from one service

  add the service label x 2,000 services
  = 154 million series
  = your cluster is now down
Every label you add multiplies. A user_id label on a per-user counter is 500,000 series from one endpoint, and it is the single most common way a metrics pipeline falls over.
The rule is: labels are for dimensions you will aggregate or filter by, not for values you will never query. instance, route, status, method earn their place because dashboards and alerts group by them. user_id, request_id, email, and a raw path with an ID in it do not, and putting an identifier in a label is the classic mistake that takes a cluster from 8 million series to 200 million.
Pull, and what a scrape actually costs
Prometheus pulls. There is no agent pushing metrics to a central collector, and the reason is that pull makes the target’s identity and availability a property of the monitoring system rather than something the target has to report correctly.
  +---------------------------+
  |  Prometheus (sharded)     |
  |  service discovery:       |
  |    kubernetes_sd          |
  |    -> pods with the right |
  |       annotation           |
  +------------+--------------+
               |  GET /metrics every 15s, per target
               v
   16,000 pods

  cost per scrape:
    - a request
    - a text parse
    - a sample append to the WAL
    - a sample in memory for the head block
The cost is not the request. It is that every sample from every target lands in a write-ahead log and eventually in memory for the head block, and that number is what the instance sizing is based on.
A sample that is stale — the target stopped responding — is written as a stale marker, and that is how a disappeared pod shows up as up = 0 rather than as silence. Silence is the enemy of alerting: a target that vanishes without a marker looks identical to a target that was never configured, and the only way to know is up.
The counter that matters for capacity planning is:
  series count x samples/sec
  = 8M series / 15s = 533,000 samples/sec
That is the ingestion rate a Prometheus has to handle, and it is the number to load-test against before adding services.
Storage: why retention and compaction dominate
Prometheus stores time series, and the volume of data is a function of series times samples times retention.
  per sample
    ~1-2 bytes in the TSDB chunk, compressed
    1.28 MB per series per day
    8M series
    = ~10 GB/day of raw samples
    x 15 days retention
    = ~150 GB
    ...plus WAL, which is larger than the chunks
This is why retention is the first thing to cut and the last thing anyone thinks about. Fifteen days of high-resolution data is expensive, and 30 days is not affordable at this scale.
The standard answer is downsampling, done by recording rules: a rule that aggregates a 1-minute rate and stores it at 5-minute resolution, while the 15-second resolution is kept for a short window.
# keep it fast for dashboards
- record: job:http_requests:rate5m
  expr: sum by (job, route) (rate(http_requests_total[5m]))

# long retention, coarse
- record: job:http_requests:rate1h
  expr: sum by (job) (avg_over_time(job:http_requests:rate5m[1h]))
The result is a tiered retention story: fine resolution for the last few hours, coarse for months. Long-term dashboards become cheap, and the fine-grained data is there when you are actively debugging.
Recording rules are not just for cost. They are how you make a query affordable in a way that a dashboard cannot do. sum by (job) (rate(http_requests_total[5m])) across 8 million series, evaluated on every dashboard refresh by ten people, is a self-inflicted outage of your monitoring system at exactly the moment you need it. Precompute it once, and the dashboard reads a series that already exists.
The four kinds of measurement, and only one of them pages
This is the distinction that fixes most alerting problems.
  1. symptom metrics
     "what is the user experiencing"
     - request success rate, by route
     - latency percentiles, by route
     - queue depth where users wait
     - availability, measured from outside
     -> THESE drive alerts

  2. cause metrics
     "why it might be happening"
     - CPU, memory, GC pause
     - thread pool saturation
     - connection pool usage
     - cache hit rate
     -> these EXPLAIN, they do not page
The rule that follows is the whole discipline: page on symptoms, diagnose with causes. If you page on CPU, you page on a machine that is busy but serving every user perfectly. If you page on request success rate, you page on the thing users care about, and CPU is what you look at while you respond.
The counter-argument is that symptom-only alerting is sometimes too late. It is true: a connection pool at 95% for 30 minutes degrades throughput before the error rate moves. The answer is not to page on the pool; it is to page on the symptom at a threshold that catches degradation earlier — a sustained error rate, or a latency SLO burn, rather than an absolute failure. Set the alert on the user-visible number and tune the threshold to fire early enough to act on.
Aggregates hide the incident
A short, specific example of the most common alerting bug.
  200 instances of a service
  5% of requests failing on one instance

  aggregate error rate: 5% / 200 = 0.025%
  -> alert threshold: 1%  -> DOES NOT FIRE
  -> about 1 in 4,000 requests is failing, concentrated
     on users routed to that replica, and
     nobody is paged

  per-instance error rate: 5%
  -> FIRES on exactly the broken instance
This is why the aggregation in your alert expression is a decision, not a convenience. Aggregating by service gives you fleet-level reliability and hides single-instance failures, which are the majority of real incidents. Aggregating by service, instance gives you a per-instance alert and a flood of noise when a whole region is down.
The workable answer is two rules with different scopes and different urgency:
- Fleet-level, high severity, longer window. Aggregate across instances. Fires when a large fraction is broken, which is a genuine fleet incident.
- Instance-level, lower severity, alerting on a single outlier. Fires on one bad instance, routed to the owning team rather than to a page.
And the routing matters: the second is not a page, it is a ticket or a dashboard entry. Routing by scope is what keeps a single bad replica from waking anyone.
Latency needs histograms, and percentiles need more data than you think
Average latency is close to useless. A mean of 200ms is produced by 199 requests at 10ms and one at 39 seconds, and the one is what users noticed.
  average:  200ms   "looks fine"
  p50:       10ms
  p99:      850ms   <- the problem
  p99.9:   4100ms   <- the users who complained
A histogram gives percentiles, and the requirement is that the buckets cover the range you care about. A histogram with no bucket between 500ms and 10s reports every request in that range as “in the 10s+ bucket”, which makes p99 useless exactly when you need it.
  buckets: [5ms, 10ms, 25ms, 50ms, 100ms, 250ms,
            500ms, 1s, 2.5s, 5s, 10s]
Bucket count is a per-series cost — each bucket is a separate time series — so this is a cardinality decision. A reasonable rule is that every service gets a shared, sensible bucket set, and only a handful of latency-critical endpoints get a detailed one.
The SLO-based alert is the good version of a latency page:
  burn rate
    how fast are we consuming the error budget?

    14.4x burn over 1h  -> 2% of budget in 1h
    -> page: the SLO will be exhausted in days

    6x burn over 6h    -> burn too fast
    -> page

    3x burn over 1d    -> slow burn
    -> ticket, not a page

    1x burn over 3d    -> projected miss
    -> ticket
This is multi-window multi-burn-rate alerting, and its value is that it pages on rate of budget consumption, which is a leading indicator, instead of on an absolute error count, which is a lagging one.
Alert routing is a graph
Alertmanager deduplicates, groups, routes, silences, and inhibits. The feature that saves the most time is inhibition, and it is the one most deployments leave off.
  the database is down

  +------------------------------------+
  |  firing: database_unavailable       |
  +----------------+-+-----------------+
                   | inhibits
     +-------------+-------------+----------+
     v             v             v          v
  api_5xx     checkout_5xx   search_5xx   worker_fail
  (400 services, one cause)
Without inhibition, a single database outage produces 400 pages, all of which are the same incident, and the 400 pages bury the one alert that says what is actually wrong. With inhibition, the cause alert fires and the symptom alerts are marked as inhibited — visible for diagnosis, silent for paging.
Grouping is the other one. group_by: [alertname, cluster] and group_wait of a minute means 400 alerts with the same name become one notification with 400 labels in it, and the first notification waits long enough to include the rest.
The two properties that make a pager trustworthy:
- Every page has a link to a dashboard that shows the relevant series, with the time range already set around the alert. A page that requires four queries to start investigating is a page that gets acknowledged and not investigated.
- Every page names a service owner, from a directory that is checked in CI. A page to a team that no longer owns the service is a page nobody acts on.
Failure stories worth testing
Add a user_id label to one endpoint
Watch the series count and the memory. This is the test that teaches cardinality, and it should be run in a non-production Prometheus so you can see the failure without causing one.
Restart a pod and confirm up goes to 0
Silence is not a signal. If a disappearing target produces no alert, a whole failed deployment is invisible.
Put 100 pods in a crash loop
Confirm alerts group into one notification. 100 separate pages is the state you are trying to avoid.
Take the database down
Confirm 400 services go unready, that the fleet-level rule fires, that per-service rules are inhibited, and that the total page count is small. If it is 400, inhibition is not configured.
Drive p99 latency to 4 seconds with a 5% error rate
Confirm which alert fires. If it is the error rate only, you are alerting too late for a latency-driven incident.
Raise CPU to 95% with no user impact
Confirm nothing pages. Then write the alert that does fire, and route it to a ticket rather than a page.
Make one instance return 500s and the rest are healthy
Confirm the per-instance rule fires and the fleet rule does not. This is the aggregate-hides-the-incident test.
Misspell a metric name in a rule
The rule silently never fires. Alerting rules need the same testing as application code, ideally with a test that evaluates the expression against known data and asserts it fires.
Set the clock forward on the Prometheus host
Confirm retention behaviour and that recorded rules do not produce a burst of alerts for the skipped interval. Time-based recording rules misbehave.
Delete a series and re-add it with a different label set
Confirm the old series is marked stale and does not linger in queries. A stale series that never expires produces graphs with two lines where there should be one.
Trigger a 4-hour sustained degradation
Confirm the slow-burn rule tickets rather than pages, and that someone actually looks at tickets. This is the test that tells you whether your non-urgent tier exists or is a fiction.
A production-ready architecture
  16,000 pods
      |  /metrics, every 15s
      |  pull, service discovery from k8s
      v
  +---------------------------+
  |  Prometheus (sharded by   |
  |  job hash) x replicas     |
  |  - head block in RAM      |
  |  - WAL on disk            |
  |  - cardinality budget     |
  +------------+--------------+
               |  remote write
               |  (or a Prometheus-compatible
               |   long-term store)
               v
  +---------------------------+
  |  long-term storage        |  downsampled series,
  |  5m and 1h resolution     |  13 months retention
  +------------+--------------+
               |
               |  rules evaluate locally
               v
  +---------------------------+
  |  recording rules          |  precompute what dashboards
  |  rate5m, rate1h, p99     |  and alerts query
  +------------+--------------+
               |
               |  alerts
               v
  +---------------------------+
  |  Alertmanager             |
  |  group_by + group_wait    |
  |  inhibit_rules            |  <- the important part
  |  silence                  |
  |  routing by owner         |
  +------------+--------------+
               |
      +--------+---------+
      |                  |
      v                  v
  +---------+      +-------------+
  | PAGER   |      | TICKET      |
  | sym:    |      | low urgency |
  | symptom |      | long burn   |
  | + burn  |      | single bad  |
  |   rate  |      | instance    |
  +---------+      +-------------+
A sensible delivery checklist:
- Set a per-service cardinality budget and enforce it in CI. A label-set linter that runs on the exporter is the only thing that reliably catches a
user_id. - Prefer a small fixed set of dimensions:
service,instance,route,status,method. Never an identifier or a raw path. - Keep a slow, comprehensive scrape interval; do not scrape faster to fix an alert that fires too late.
- Precompute everything dashboards and alerts query. Nothing expensive runs at query time.
- Downsample for retention, and accept that long-term data is coarse.
- Page on symptoms: success rate, latency, and availability from outside. Keep causes for dashboards.
- Alert on burn rate with multiple windows rather than on a single absolute threshold, and page on fast burn only.
- Run both a fleet-scope and an instance-scope rule for every service, and route the instance-scope one to a ticket.
- Configure inhibition before you need it, and test it by taking a dependency down.
- Every alert gets a dashboard link with the time range pre-set, and a named owning team checked in CI.
- Test alerting rules as code. A rule that never fires because of a typo is the most expensive silent failure in the platform.
- Track alert volume and the ratio of pages that led to action. If that ratio is low, the fix is deleting alerts, and the measurement is what makes the deletion defensible.
Common mistakes
| Mistake | What actually happens | Better decision |
|---|---|---|
user_id or request_id in a label |
Series count explodes, cluster falls over | Cardinality budget, enforced in CI |
| Single Prometheus for 2,000 services | Ingests until it OOMs | Shard by job hash, replica per shard |
| Expensive queries in dashboards | Monitoring falls over during the incident | Recording rules, precomputed |
| Only 7 days of retention | Long-term debugging impossible | Downsample, keep coarse data longer |
| Buckets missing the range you care about | p99 useless in the latency range that matters | Bucket set covering the real distribution |
| Averaging latency | A 39s request hides inside a 200ms mean | Histograms, report percentiles |
| Page on CPU or memory | Pages for a busy machine serving users fine | Page on symptoms, diagnose with causes |
| Aggregate error rate only | Single broken instance is invisible | Per-instance rule, routed to a ticket |
| No inhibit rules | One dependency down means 400 pages | Inhibit symptoms by cause |
| No group_wait | Partial alert storms for the same thing | Group by name, wait for the group to fill |
| Alert with no dashboard link | Investigation starts with four queries | Pre-set time range on the link |
| No owner in the alert | Pages a team that no longer owns it | Ownership checked in CI |
| Untested alerting rules | A typo means the rule never fires | Test expressions against known data |
| Target disappears silently | Failed deployment is invisible | up metric, stale markers |
| Page on every user-visible error | 5% fleet errors from one bad deploy, fine | Burn rate, multi-window |
| No tiering of urgency | Long degradation pages someone every hour | Fast burn pages, slow burn tickets |
| Bucketing by raw path with IDs | Cardinality grows with traffic | Normalise the route, drop IDs |
| Single scrape interval tuned for 100 services | Wasteful at 2,000, or too slow to catch | 15-30s, fixed, not per-service |
| Alerting rules evaluated per replica | Duplicate evaluations, inconsistent | Leader evaluation within a shard |
| Measuring alerts sent, not alerts acted on | Volume looks healthy, outcomes are not | Track the action ratio and delete the rest |
| No cardinality monitoring | The first sign is an OOM kill | Gauge the series count, alert on growth |
The complete story in one minute
The whole alerting problem follows from one fact: metrics describe the system, alerts should describe the experience. Pages belong on symptoms — success rate, latency, availability from outside — and causes like CPU and pool saturation belong on the dashboard you open while you respond. A machine at 95% CPU serving every user perfectly is not a page, and paging on it is how you train people to ignore pages.
Cardinality is what decides whether Prometheus works at all. Series count is metric names times label combinations, and every label multiplies: 200 routes times 8 instances times 6 methods on 2,000 services is over a hundred million series from a single metric. Never put an identifier or a raw path in a label, set a per-service budget, and enforce it in CI because nothing else catches it.
The mechanics follow from that. Shard by job hash. Precompute with recording rules so no dashboard runs an expensive query at the moment you need it. Downsample for long retention. Use histograms with buckets covering the range you care about, because a mean latency hides the 39-second request and a histogram with no bucket in that range makes the p99 useless exactly when it matters.
Then the two things that make alerts trustworthy. Alert on multiple-window burn rate rather than an absolute threshold, so you page on rate of budget consumption instead of on failure after the fact. And configure inhibition, because a database outage otherwise produces 400 pages that bury the one alert naming the cause — and route instance-scope rules to a ticket rather than a page, so a single bad replica is fixed by someone who is already awake for a different reason.
scrape: pull every 15s, cardinality is the budget
query: precompute with recording rules
page:  symptom + burn rate + inhibit + group + owner + dashboard
diagnose: causes, on the dashboard the link points at
The hard part was never building a good expression. It was deciding which of the things you could measure were worth interrupting a human for.
Technical references
Related notes.
LSM Compaction: The Background Job That Becomes a Foreground Outage
Why an LSM engine saturates a disk with no user traffic, how write stalls turn a background merge into a latency incident, and why the disk needs headroom a capacity graph will never show.
CockroachDB from First Principles: The Database That Refuses to Die
Why a global SQL database is really a problem of agreement and time, how Google solved it with TrueTime, GPS, and atomic clocks, and how CockroachDB reaches a practical design on ordinary infrastructure.

Read Replicas: The Right Answer, the Wrong Moment, and How to Keep Users From Seeing It
Asynchronous replication separates primary commit, standby receipt, durable flush, and replay. Read-your-writes depends on replay; failover loss depends on what reached the promoted standby.